Linked Diagram of Academic System
RJ0500007_24
- Last Update 06/09/2025
- File Size 1.3MB
- # of Slides 2
- File Format PPTX
- Slide Ratio 16:9
- Color
Keywords
About the Product
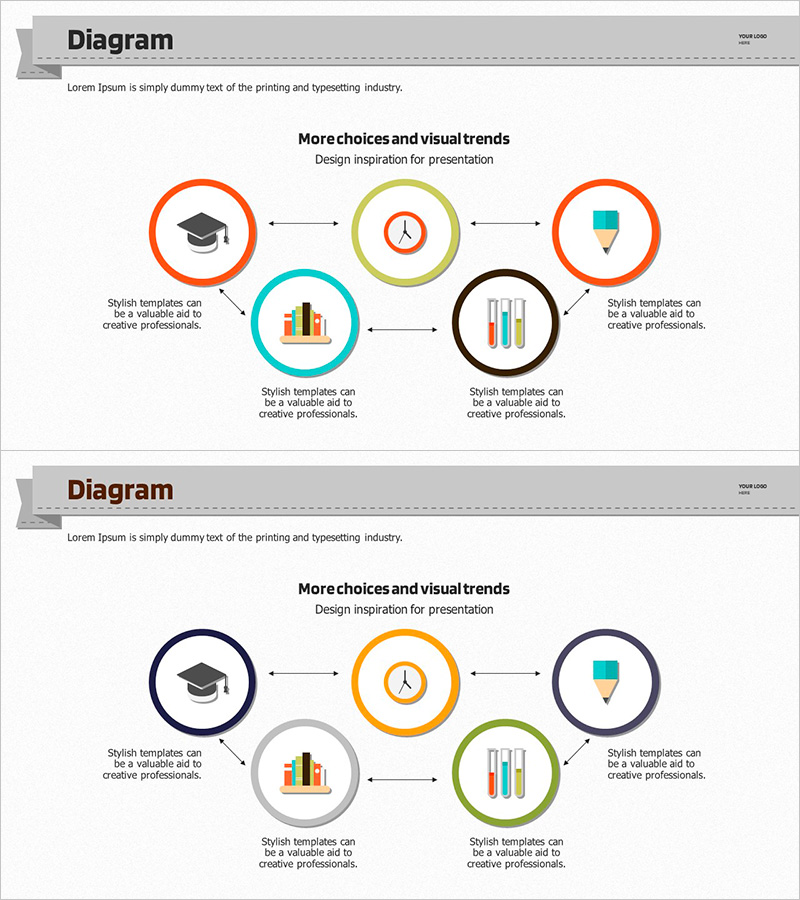
A 5-node connected diagram PowerPoint slide that visualizes the interconnected relationships between academic systems and related elements. The structure features a central core element (time management) connected to four surrounding nodes (graduation, chart, pen, chart) through bidirectional arrows, effectively representing process interactions and feedback loops. Multi-colored circular borders in orange, yellow, blue, and black, combined with icons, distinguish each stage, while descriptive text areas enable immediate use in presentations. Provided in 2-slide PPTX format with 16:9 widescreen aspect ratio.
Usage Points
-
Main Usage
Clearly express interconnected relationships within organizations, processes, and systems. This diagram visualizes bidirectional interactions, feedback loops, and integrated structures between a central core element and surrounding components, applicable to academic frameworks, business processes, inter-organizational collaboration, and system integration scenarios.
-
How to Use
Input element names corresponding to each node (circular icons) and designate the central element as the core concept. Enhance presentation content by adding descriptions in text areas for each stage, and customize node colors and icons as needed to align with organizational or project characteristics.
-
Recommended For
Educational institution academic system explanations, corporate inter-departmental collaboration structures, project management phases and stakeholder relationship diagrams, business model core elements and interaction visualization, consulting proposal system integration structures, and organizational workflow documentation.
-
Slide Structure
2-slide composition. Each slide features a central core node connected to four surrounding nodes via bidirectional arrows in a 5-node structure. Each node is distinguished by differently colored circular borders and icons, with descriptive text areas positioned at the bottom for additional information.
Related Products
-

Business Connection 3D Diagram – Business Strategy
#Business Strategy #Operational Plan #Diagram
-

Telescope Astrophotographic Infographic – Visualizing Business Development Strategy
#Business Strategy #Operational Plan #Diagram
-

Transport Icons and Flowcharts – Business Strategy
#Business Strategy #Operational Plan #Diagram
-

Cascading Bubble Flow Slide – Business Strategy and Operations Planning
#Business Strategy #Operational Plan #Diagram
