Highlight Area Chart and Brief Message – Market Analysis Insights
RJ0500006_11
- Last Update 06/08/2025
- File Size 0.6MB
- # of Slides 2
- File Format PPTX
- Slide Ratio 16:9
- Color
Keywords
- #Content-Based Slides
- #Design-Based Slides
- #Market and Competitor Analysis
- #Graph
- #Other
- #Customer Analysis
- #Competitive Advantage
- #16:9
- #stacked area chart PowerPoint
- #two-layer data visualization slide
- #market analysis presentation
- #competitive advantage chart
- #how to create area chart in PowerPoint
About the Product
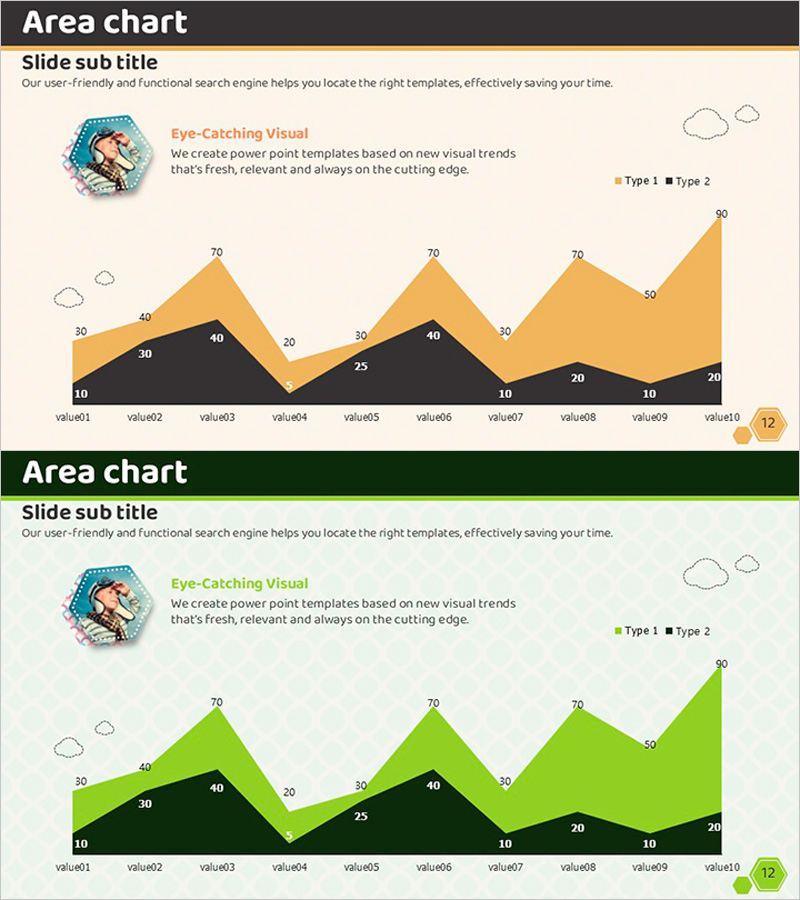
A stacked area chart PowerPoint slide optimized for market analysis and competitive positioning presentations. The two-layer structure in gold and black visualizes 10 time-series data points across Type 1 and Type 2 categories, enabling intuitive comparison of market trends and customer segments. The slide includes a circular illustration on the left, legend on the right, and descriptive text area at the top for immediate use in competitive analysis, market outlook, and customer segmentation presentations. The 2-slide set provides color variations (gold and green) to match your presentation tone.
Usage Points
-
Main Usage
Designed to display two-category time-series data simultaneously while emphasizing trend changes across market conditions, competitor performance, or customer segments. The stacked format conveys both total volume and individual category proportions in a single visualization.
-
How to Use
Enter your analysis topic in the title and subtitle areas at the top. Add key insights to the text section beside the left illustration. Replace value01–value10 data points and Type 1·Type 2 figures with your actual analysis results, then use as your presentation slide.
-
Recommended For
Ideal for marketing, sales, and strategy teams presenting market analysis; investor pitches on competitive advantages; customer-facing market trend reports; and executive briefings. Particularly effective when comparing performance across two products, services, or customer segments.
-
Slide Structure
Composed of three information blocks: title and subtitle text area (1), left circular illustration with descriptive text (1), and right stacked area chart with legend (1). Text, imagery, and data are balanced across the layout for clear information hierarchy.
Related Products
-

Gender Surgery Comparison Analysis Graph – Understanding Markets and Competitive Edge
#Market and Competitor Analysis #Graph #Other
-

Travel Business Target Market and Customer Analysis Slide
#Market and Competitor Analysis #Graph #Other
-

Statistics on People's Physical Fitness in Bar Chart – Insights Aimed at Competitive Advantage
#Market and Competitor Analysis #Graph #Other
-

Collaboration Silhouette Diagram – Visual Tool for Customer Analysis
#Market and Competitor Analysis #Graph #Other
