Field Introduction Triangle Diagram – Visualizing Business Areas
RJ0500004_5
- Last Update 06/08/2025
- File Size 2.3MB
- # of Slides 2
- File Format PPTX
- Slide Ratio 16:9
- Color
Keywords
- #Content-Based Slides
- #Design-Based Slides
- #Company Introduction
- #Business Introduction
- #Diagram
- #Business Areas
- #Business Areas
- #Spread
- #16:9
- #business area diagram PowerPoint
- #triangle diagram slide
- #5-section business visualization
- #how to create a business area diagram in PowerPoint
- #pyramid expansion slide template
About the Product
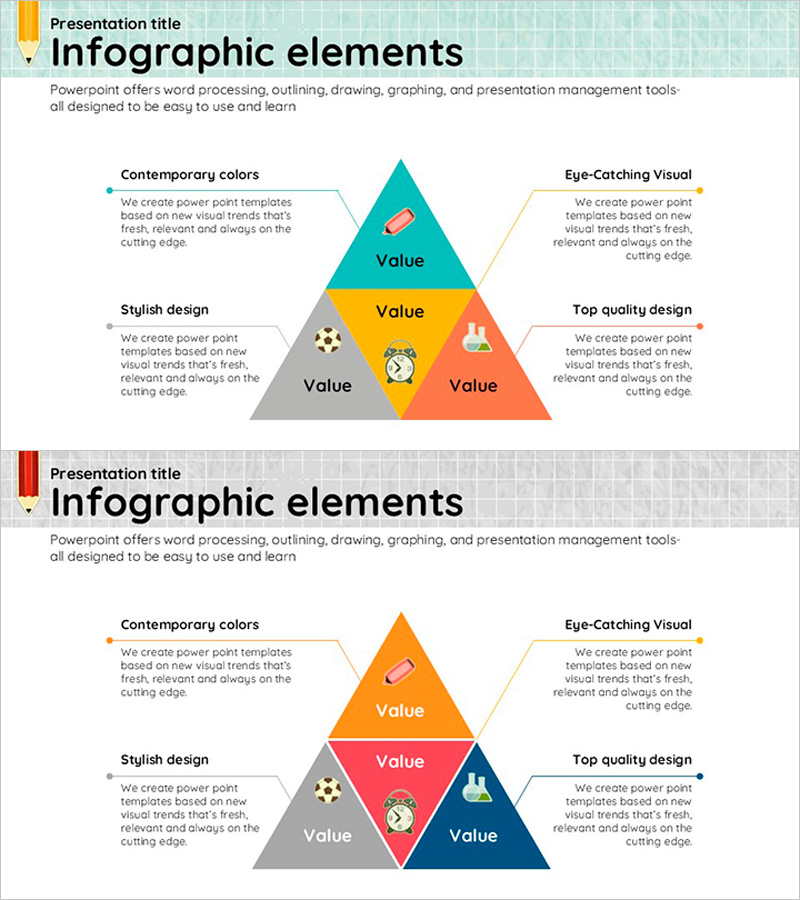
A PowerPoint slide featuring a triangle diagram optimized for business area visualization and business introduction. The pyramid structure places five core values in the central sections, with four surrounding areas connected for detailed explanations. Five distinct colors—teal, yellow, orange, pink, and navy—differentiate each section to enhance information delivery, while icons and text boxes support intuitive understanding. This fully editable slide is ready for immediate use in business strategy presentations, company profiles, and product positioning materials.
Usage Points
-
Main Usage
Visualize business areas, core values, and business strategy using a multi-section pyramid structure to enhance audience comprehension. Central five sections hold key messages while surrounding four areas provide detailed explanations, enabling hierarchical information delivery.
-
How to Use
Apply this slide in company profile business area sections, business plan model explanations, product positioning presentations, and strategy meeting materials. Edit the text and icons in each section to match your business content and use immediately.
-
Recommended For
Recommended for executives explaining business strategy, marketing professionals introducing new business areas, startup founders preparing investment pitch decks, and HR professionals communicating organizational core values.
-
Slide Structure
A pyramid triangle with five central sections (yellow, orange, pink, navy, teal) connected to four surrounding areas containing title, description, and icon-integrated text boxes. Two-slide set provides color variations: first with teal tone, second with orange tone.
Related Products
-

Diffusion Graph without Business Focus – Flexible Business Presentation
#Company Introduction #Business Introduction #Diagram
-

Circular Graph Diagram for Business Introduction
#Company Introduction #Business Introduction #Diagram
-

Hexagonal Diffusion Diagram for Business Area Visualization
#Company Introduction #Business Introduction #Diagram
-

Management Business Area Diagram – Effective Business Introduction
#Company Introduction #Business Introduction #Diagram
