Financial Services Solutions Diagram – Highlighting Business Core and Values
RJ0300084_8
- Last Update 05/13/2025
- File Size 0.4MB
- # of Slides 2
- File Format PPTX
- Slide Ratio 16:9
- Color
Keywords
- #Content-Based Slides
- #Design-Based Slides
- #Company Introduction
- #Business Introduction
- #Diagram
- #Business Areas
- #Business Areas
- #Spread
- #Centralized Diagram
- #16:9
- #radial diagram PowerPoint
- #central node presentation slide
- #business value diagram
- #4-node diagram template
- #financial services diagram PowerPoint
- #core message emphasis slide
About the Product
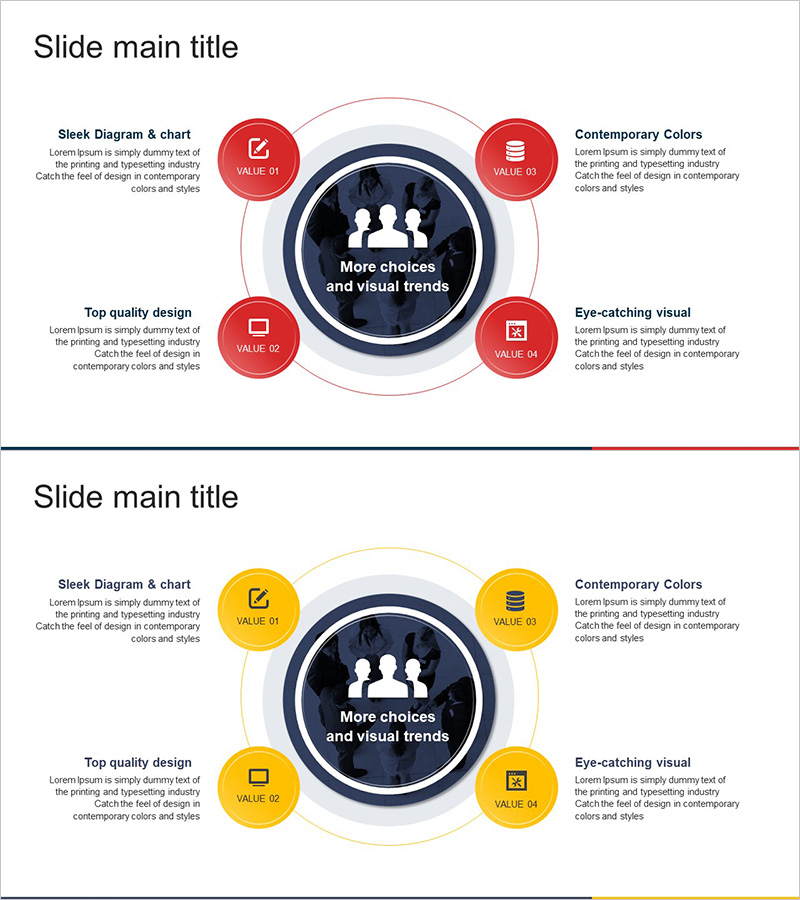
A PowerPoint slide template featuring a central core message surrounded by four radial nodes to visualize business values and strategic elements. Available in two color versions—red and yellow—with icons and text areas in each node. Optimized for financial services presentations, solution pitches, and business model explanations, this diagram slide is ready to use in corporate presentations and company introductions. Includes 2 slides in 16:9 widescreen format.
Usage Points
-
Main Usage
Visualizes the relationship between a company's core value and surrounding business elements at a glance. The central circle emphasizes the key message while four radial nodes present major points (values, options, design, visual impact) in balanced arrangement to capture audience attention.
-
How to Use
Insert your core message or company logo in the central circular area, then add key points and descriptive text to each of the four radial nodes. Select the color version that matches your corporate brand and presentation theme. Applicable to financial solutions, business model explanations, and organizational structure presentations.
-
Recommended For
Ideal for financial services companies presenting solutions, business consultants pitching strategies, corporate introductions, investment pitch decks, and marketing planning documents. Recommended for executives, sales teams, marketing professionals, and consultants who need to communicate strategy and value effectively.
-
Slide Structure
Consists of 2 slides, each featuring a central circular node (core message area) surrounded by four radial circular nodes positioned at top, bottom, left, and right. Each node includes icon, title, and descriptive text input areas. Available in two color style versions: red and yellow.
Related Products
-

Hexagonal Diffusion Diagram for Business Area Visualization
#Company Introduction #Business Introduction #Diagram
-

Infographic Slide Visualizing Collaborative Business Areas
#Company Introduction #Business Introduction #Diagram
-

Vaccine Diffusion Diagram – Business Introduction and Diffusion Strategy
#Company Introduction #Business Introduction #Diagram
-

Business Value Diagram – Visualizing Business Sectors
#Company Introduction #Business Introduction #Diagram
