Connected Performance Diagram – Central to Business Strategy
RJ0500004_18
- Last Update 06/08/2025
- File Size 2.2MB
- # of Slides 2
- File Format PPTX
- Slide Ratio 16:9
- Color
Keywords
- #Content-Based Slides
- #Design-Based Slides
- #Business Strategy
- #Diagram
- #Step-by-Step Schedule Plan
- #Cluster
- #Chain Diagram
- #Project Progress
- #16:9
- #connected diagram PowerPoint slide
- #business progress diagram
- #4-stage process flow
- #business strategy presentation
- #how to create process diagram in PowerPoint
About the Product
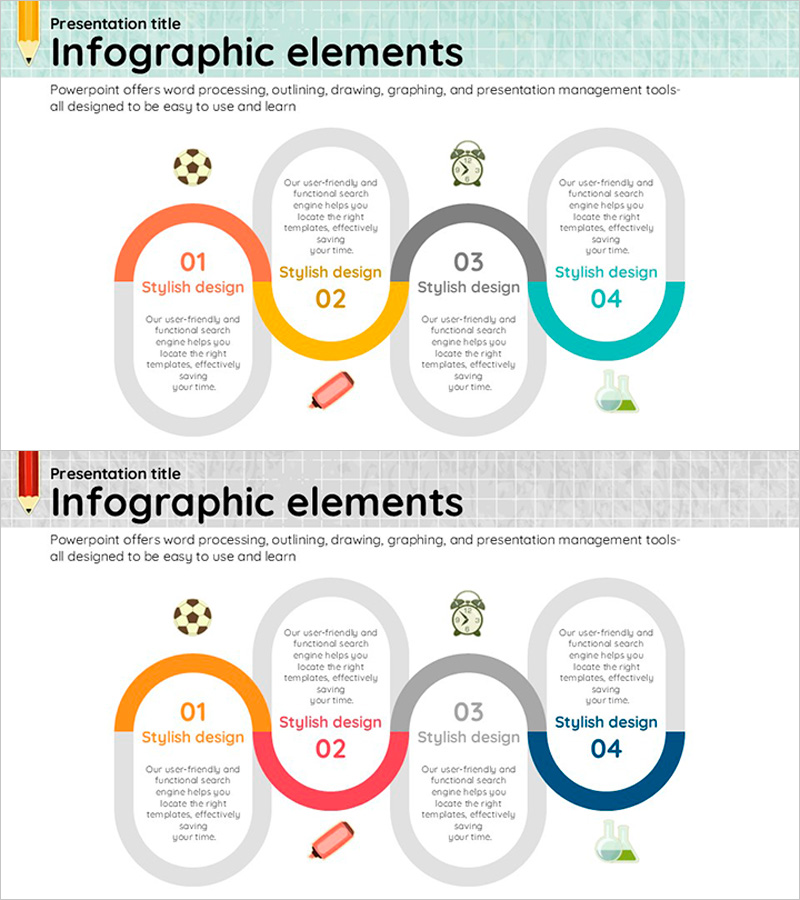
A connected diagram PowerPoint slide that visualizes business strategy progress across four sequential stages. The design features four semicircular nodes in orange, yellow, gray, and teal colors, linked horizontally to show process flow. Each stage includes dedicated text input areas and icon placement zones for presenting performance metrics, strategic initiatives, and progress updates. The 2-slide set offers multiple color variations optimized for 16:9 widescreen format, making it ideal for executive presentations and business strategy communications.
Usage Points
-
Main Usage
This diagram is designed to communicate business progress across sequential stages in a clear, visual format. The four connected nodes represent stages of a business initiative, allowing presenters to highlight achievements, milestones, and strategic direction. Ideal for executive briefings, business reviews, and strategy presentations.
-
How to Use
Enter stage names (01–04) and corresponding achievements or metrics in each semicircular node. Use the central yellow connector area to add cross-stage messaging or strategic linkages. Add relevant icons or images in the designated icon zones to enhance visual impact. Customize colors to match your presentation theme or corporate branding.
-
Recommended For
Business managers, project leads, and executives presenting progress updates and strategic initiatives. Suitable for business plans, management reports, strategy presentations, and investor pitches. Effective for government-funded projects, internal business reviews, and stakeholder communications where sequential progress needs clear visualization.
-
Slide Structure
2-slide set with two color variations. Each slide features four horizontally connected semicircular nodes, each with dedicated text input areas (title and description) and icon placement zones. The central connector serves as a focal point for cross-stage relationships or key messaging.
Related Products
-

Horticultural Flow Step Analysis – Business Strategy Diagram
#Business Strategy #Diagram #Step-by-Step Schedule Plan
-

Flower and Flow Diagram – Business Strategy
#Business Strategy #Diagram #Step-by-Step Schedule Plan
-

Single Slide Template for Visualizing Stages of Lung Cancer
#Business Strategy #Diagram #Step-by-Step Schedule Plan
-

Eco-friendly Business Strategy Arrow Connection Diagram – Roadmap for Sustainable Development
#Business Strategy #Diagram #Step-by-Step Schedule Plan
