Blue Red Bundle Chart – An Effective Tool for Competitor Analysis
RJ0500001_14
- Last Update 06/07/2025
- File Size 1.2MB
- # of Slides 2
- File Format PPTX
- Slide Ratio 16:9
- Color
Keywords
About the Product
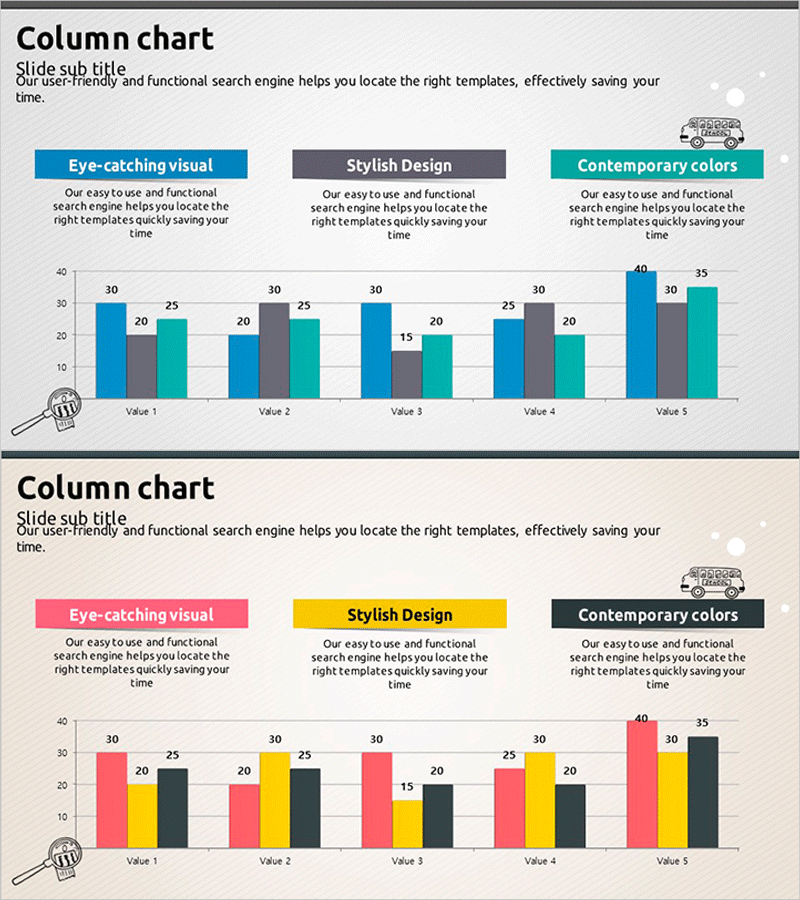
A 2-slide PowerPoint presentation featuring grouped column charts optimized for competitor analysis and performance benchmarking. The first slide uses a blue, gray, and teal color palette, while the second employs pink, yellow, and charcoal tones. Each slide displays 5 data items (Value 1–5) with 3 data series arranged side-by-side, enabling simultaneous comparison across items and between series. Title, descriptive text areas, and icon elements enhance the professional appearance of your presentation. Delivered in 16:9 widescreen PPTX format, fully editable and ready to customize.
Usage Points
-
Main Usage
Displays 5 data items with 3 series arranged in grouped columns, enabling direct comparison of values across items and between series simultaneously. Ideal for competitor benchmarking, product feature evaluation, quarterly performance analysis, and multi-dimensional data presentation.
-
How to Use
Adjust bar heights to input your actual data values. Modify legend labels and axis titles to reflect your comparison categories and measurement units. Select the color palette that best matches your presentation theme and audience context. Edit title and descriptive text to highlight key findings and insights.
-
Recommended For
Executives, marketing teams, sales professionals, consultants, and data analysts presenting competitive analysis, product performance evaluation, and market research findings. Effective for strategy meetings, investor reports, client proposals, and stakeholder presentations requiring quantitative multi-series comparison.
-
Slide Structure
2-slide deck. Each slide contains a title area, 3-color legend boxes, grouped column chart with 5 items and 3 series, descriptive text section, and icon elements. First slide: blue, gray, teal palette. Second slide: pink, yellow, charcoal palette for visual variety across different presentation contexts.
Related Products
-

Eco-friendly Vertical Bar Graph in Blue and Yellow
#Market and Competitor Analysis #Graph #Competitor Analysis
-

Blue Orange Competitive Analysis Bar Graph
#Market and Competitor Analysis #Graph #Competitor Analysis
-

Competitor Analysis by Year Bundled Graph – Market Trend Insights
#Market and Competitor Analysis #Diagram #Graph
-

Competitiveness Table and Chart Analysis – Market and Competitor Analysis
#Market and Competitor Analysis #Diagram #Graph
