History of AI Robot Development – Journey of Technological Innovation
RJ0400072_5
- Last Update 06/07/2025
- File Size 0.2MB
- # of Slides 2
- File Format PPTX
- Slide Ratio 16:9
- Color
Keywords
About the Product
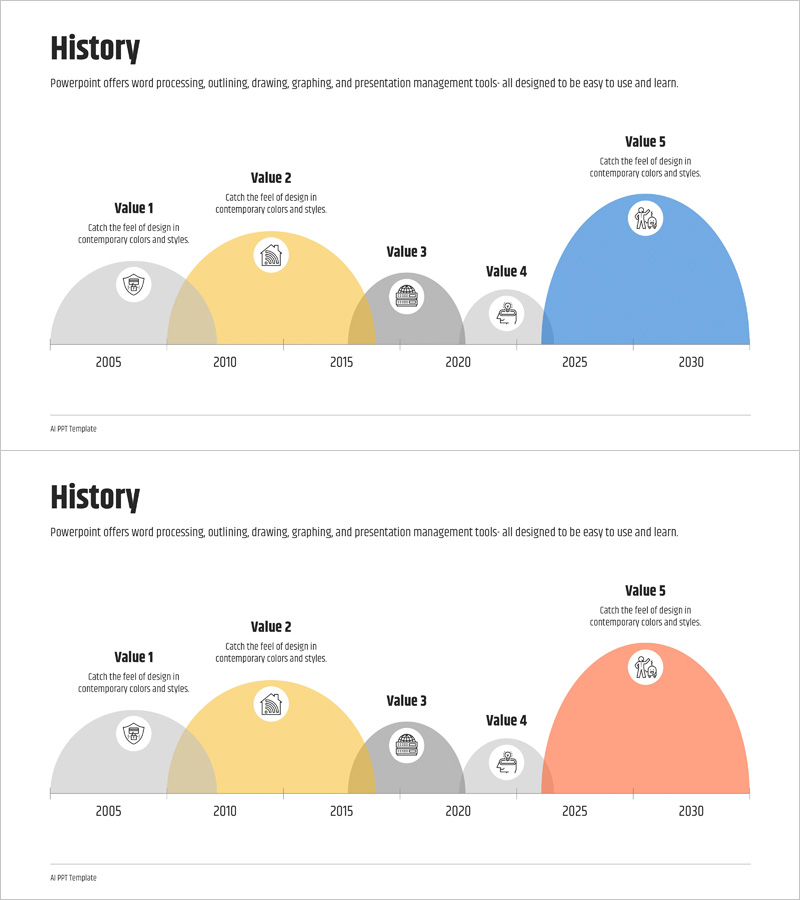
A PowerPoint slide that visualizes technological innovation and organizational growth across five nested semicircular shapes arranged along a central timeline axis. The design uses grayscale, yellow, and blue gradient tones to distinguish each phase, with symmetrical icon and text areas positioned above and below the timeline from 2005 to 2030. This presentation template is ideal for roadmap presentations, business evolution narratives, and development journey storytelling. The nested structure allows each stage to represent key milestones, innovation breakthroughs, and strategic achievements in a hierarchical visual format.
Usage Points
-
Main Usage
Designed to present long-term development narratives such as technology roadmaps, business expansion timelines, organizational growth trajectories, and product evolution stories. The nested semicircle structure enables layered representation of each period's core values, innovation highlights, and measurable outcomes in a visually compelling format.
-
How to Use
Enter timeline years, phase names, and key achievements in the five text areas positioned above and below the central axis. Insert representative icons or images in the designated icon zones within each semicircle, and adjust colors to match your presentation brand guidelines. The 16:9 widescreen format is optimized for large-screen presentations and conference displays.
-
Recommended For
Technology companies presenting R&D milestones, manufacturing firms showcasing product development history, consulting firms illustrating client growth trajectories, educational institutions explaining departmental evolution, government agencies reporting policy implementation progress, and startups demonstrating innovation journey.
-
Slide Structure
Five nested semicircular shapes symmetrically arranged above and below a central timeline axis spanning 2005–2030. Each shape includes year labels, icon placeholder areas, and text description zones. Color progression: grayscale (2005), yellow (2010), grayscale (2015), grayscale (2020), and blue (2025–2030) for visual phase differentiation.
Related Products
-

Diagram Introducing Business Activity Areas – Visualizing Business Areas
#Company Introduction #Business Introduction #Diagram
-

Medical Pictogram Overlay Diagram
#Company Introduction #Business Introduction #Diagram
-

Business Area Overlay Diagram – A Blend of Visual Appeal and Functionality
#Company Introduction #Business Introduction #Diagram
-

Historical History Diagram by Year – Business Strategy and Vision
#Company Introduction #Business Strategy #Diagram
