Network Development Status Graph - Effective Data Visualization
RJ0400070_5
- Last Update 06/06/2025
- File Size 2.5MB
- # of Slides 2
- File Format PPTX
- Slide Ratio 16:9
- Color
Keywords
- #Content-Based Slides
- #Design-Based Slides
- #Product/Service Introduction
- #Graph
- #Other
- #Composition
- #Development Status
- #16:9
- #network development status PowerPoint slide
- #development progress graph template
- #project progress bar visualization
- #IT project status PPT
- #data visualization PowerPoint template
About the Product
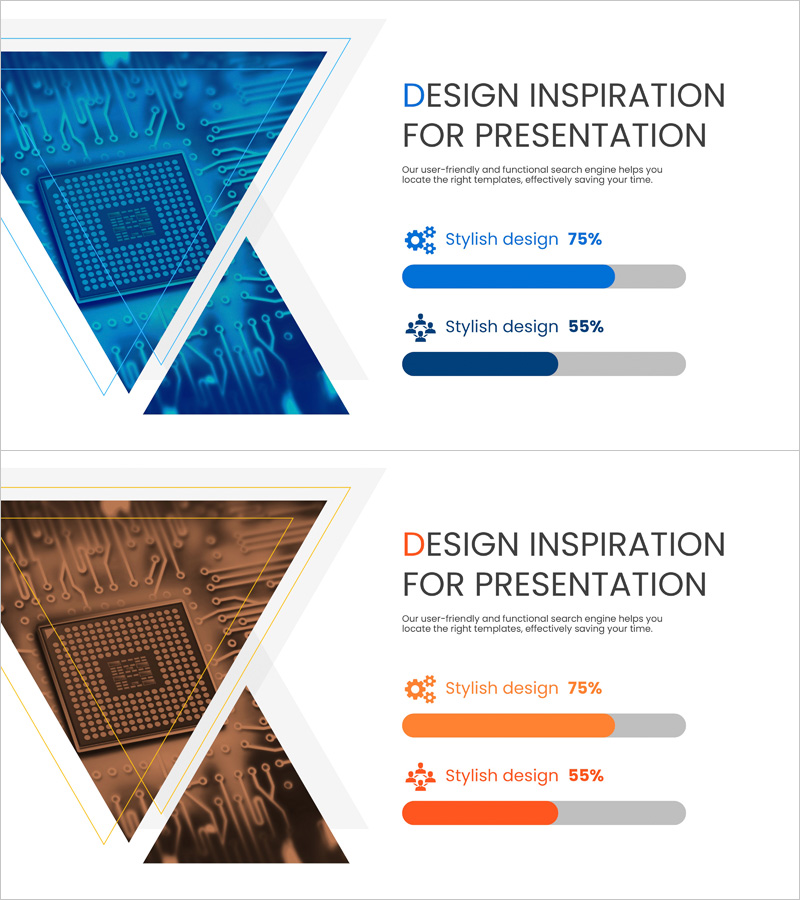
A professional PowerPoint slide set for visualizing IT project progress and network development status. This 2-slide template features a dark blue background with bright blue progress bars and icons, designed to convey technical credibility and project milestones. The layout clearly separates descriptive text areas from data visualization zones, making it ideal for presenting development completion rates, progress metrics, and timeline achievements. Ready to use in presentations, reports, and business communications, with fully editable colors and numerical values.
Usage Points
-
Main Usage
Effectively communicate IT project progress, network infrastructure development, and system implementation status to stakeholders. The progress bar visualization and icon elements transform complex technical data into intuitive, easy-to-understand graphics that build confidence in project execution.
-
How to Use
Deploy in business reports, investor presentations, executive briefings, and project kickoff meetings to explain development progress. Simply update the text content and numerical values to match your project status, then present immediately without additional design work.
-
Recommended For
IT companies, software development teams, systems integration firms, technical project managers, CIOs, and business development professionals who need to demonstrate technical expertise and clearly communicate project advancement to executives and investors.
-
Slide Structure
Two-slide layout with each slide containing one title area, one text description zone, two to three progress bars, and icon elements. Dark blue background with bright blue accent colors establishes technical authority and professional credibility appropriate for technology sector presentations.
Related Products
-

Data Status Analysis Pie Chart – Intuitive Visualization
#Product/Service Introduction #Graph #Other
-

Data Analysis Status Pie Chart – A Tool for Clear Understanding
#Product/Service Introduction #Graph #Other
-

Five Color PowerPoint Template Wide – Donut Chart
#Product/Service Introduction #Business Vision and Strategy #Graph
-

Camera Donut Chart and Table – Market and Competitive Analysis
#Product/Service Introduction #Market and Competitor Analysis #Graph
