Cloud System Service Configuration Diagram – Modern Design and Visual Appeal
RJ0400070_26
- Last Update 06/06/2025
- File Size 2.2MB
- # of Slides 2
- File Format PPTX
- Slide Ratio 16:9
- Color
Keywords
- #Content-Based Slides
- #Design-Based Slides
- #Technical Approach
- #Diagram
- #Service Architecture Diagram
- #Service Implementation Plan
- #Cluster
- #Chain Diagram
- #16:9
- #connection diagram PowerPoint
- #central node slide template
- #cloud system architecture diagram
- #technology network diagram
- #four-way radial diagram
- #PowerPoint diagram slide design
About the Product
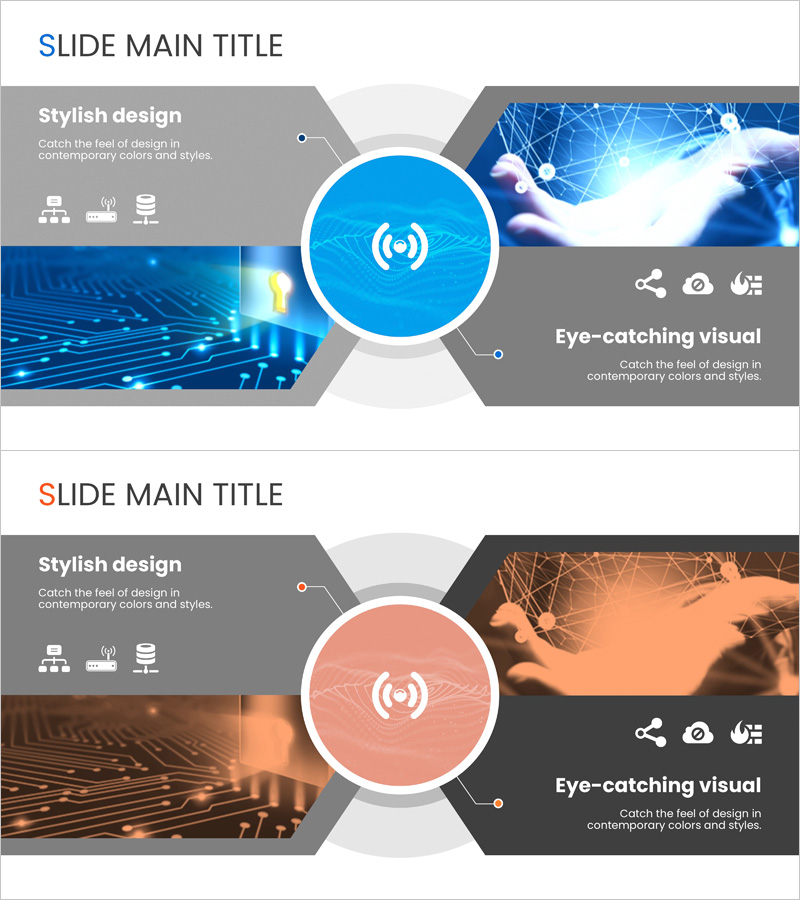
A radial connection diagram PowerPoint slide with a central circular node extending to four directional sections. The bright blue center circle contrasts with gray rectangular areas, each containing icons and text zones. This 2-slide set is optimized for technology, cloud, and network system architecture presentations in 16:9 widescreen PPTX format. Visually represents service structures, technical architectures, and system interconnections with intuitive clarity. Each node area supports free editing of text and images for customization.
Usage Points
-
Main Usage
Visualizes cloud service structures, technical systems, and network architectures with clear interconnection relationships. The four-way radial structure from a central concept suits service composition, technology stack, and system integration explanations.
-
How to Use
Enter core service or technology name in the central circular node, then populate four sections with respective features, modules, or connection targets. Customize by replacing section icons or modifying background images to match brand guidelines.
-
Recommended For
IT and cloud company technology presentations, system architecture explanations, service configuration diagrams, network infrastructure overviews, digital transformation project proposals, and technology partnership pitch decks.
-
Slide Structure
2-slide set. Each slide divides into a central circular node (approximately 30% diameter) and four directional rectangular areas (each 25%), with connecting lines and small circular points around the node. Each directional section includes three icons, title text, and description text input areas.
Related Products
-

Introduction to Social Media Services – Cluster Connection Diagram
#Technical Approach #Marketing Plan and Strategy #Diagram
-

IT Intra Business Process Diagram – Intuitive Representation of Technical Efficiency
#Operational Plan #Technical Approach #Diagram
-

Instrument Repair Diagram – Secrets of Technical Management
#Operational Plan #Technical Approach #Diagram
-

Service Composition Diagram Circular Diagram – Clustering and Connection
#Product/Service Introduction #Technical Approach #Diagram
