VR Service Area Illustration Diagram – Vision of Future Services
RJ0400065_4
- Last Update 06/05/2025
- File Size 0.5MB
- # of Slides 2
- File Format PPTX
- Slide Ratio 16:9
- Color
Keywords
- #Content-Based Slides
- #Design-Based Slides
- #Company Introduction
- #Product/Service Introduction
- #Diagram
- #Business Areas
- #Product/Service Introduction
- #Cluster
- #Closed Cluster Diagram
- #16:9
- #cluster diagram PowerPoint
- #VR service presentation slide
- #4-area illustration diagram
- #business area hexagon slide
- #service portfolio PPT template
About the Product
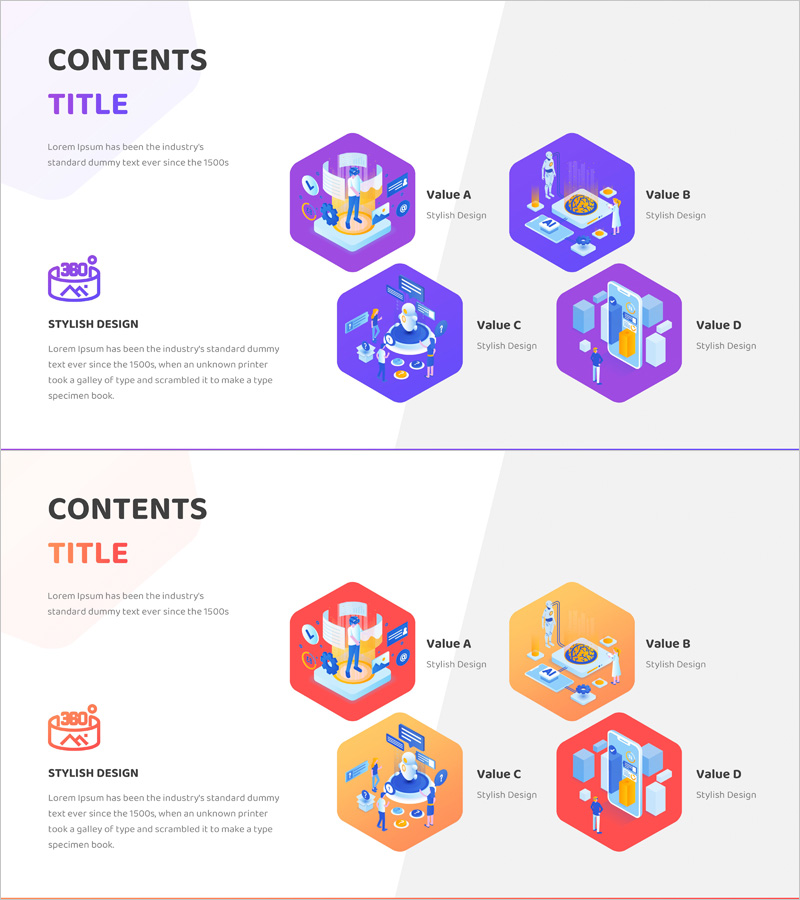
A cluster diagram PowerPoint slide representing VR service areas through four hexagonal nodes with isometric illustrations. Featuring purple and orange color schemes, this presentation template visualizes key service elements for business portfolios. The 2-slide set is optimized for technology company and startup presentations, enabling immediate use in service portfolio introductions and business area overviews.
Usage Points
-
Main Usage
Visualizes VR, metaverse, and technology service areas across four distinct categories using a centralized cluster structure. Each hexagonal node represents an independent service domain, effectively communicating core business portfolios through visual hierarchy.
-
How to Use
Deploy in technology company pitches, startup investor presentations, product launch events, and business overview meetings. Customize node text and icons to match your specific service offerings and corporate branding.
-
Recommended For
VR, metaverse, gaming, and AI technology companies / Startup founders and entrepreneurs / Technology solution marketing professionals / Digital transformation strategy presenters / Anyone requiring business area portfolio visualization
-
Slide Structure
2-slide set with 4 hexagonal nodes arranged in 2×2 grid layout per slide. Isometric illustrations in purple and orange tones represent each service area's characteristics. Clear visual hierarchy between nodes with ample space for data entry and customization.
Related Products
-

Introducing Camping Program with Isometric Diagram
#Company Introduction #Product/Service Introduction #Diagram
-

Integrated Healthcare Services Provided by the Hospital – Understanding through Structured Approach
#Company Introduction #Product/Service Introduction #Diagram
-

Transportation Business Service Introduction – Cluster Structure Overview
#Company Introduction #Product/Service Introduction #Diagram
-

Digital Marketing Introduction and Fields – Modern Presentation Slide
#Company Introduction #Product/Service Introduction #Diagram
