Business Area Data Analysis Diagram – Providing Business Insights
RJ0400060_7
- Last Update 06/03/2025
- File Size 0.6MB
- # of Slides 2
- File Format PPTX
- Slide Ratio 16:9
- Color
Keywords
About the Product
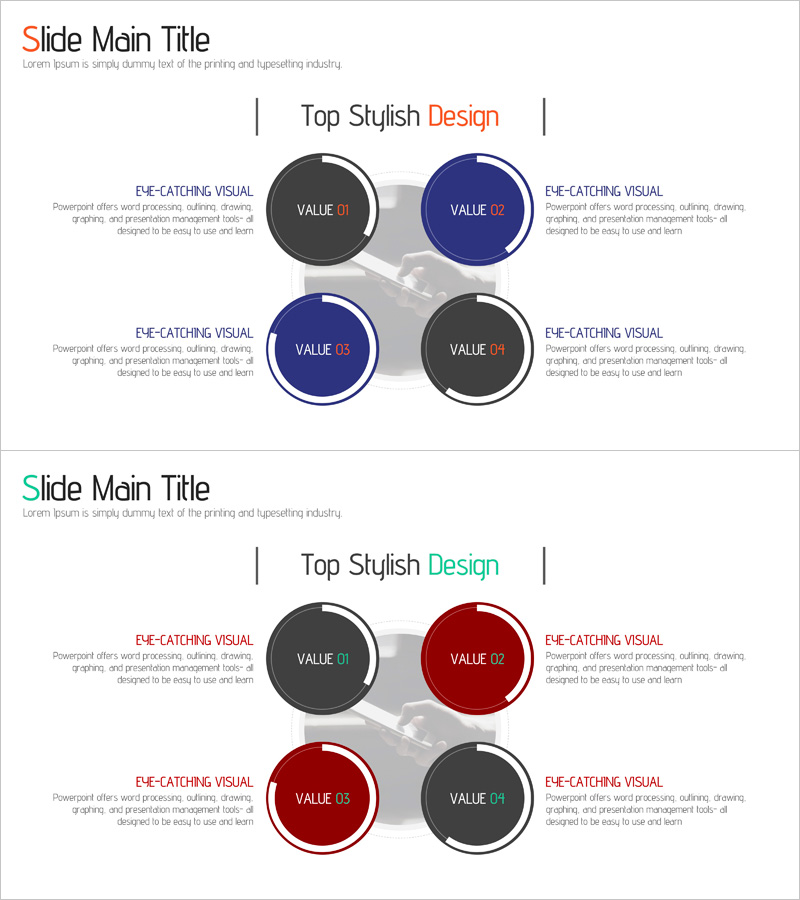
A PowerPoint slide that visualizes business areas and data analysis through four circular diagram elements arranged in a balanced, symmetrical layout. The design uses dark gray and navy blue color contrast to clearly distinguish each quadrant, with dedicated text areas on both sides for detailed explanations. Each circular element can be customized with titles and descriptions, making it ideal for company presentations, business strategy, and market analysis slides. The 2-slide set offers two color combinations—blue and gray, or red and gray—allowing you to match your corporate brand identity while maintaining professional visual hierarchy.
Usage Points
-
Main Usage
This slide compares and analyzes four key business elements—such as business areas, market segments, competitive factors, or core values—simultaneously. The circular diagram structure visually emphasizes the importance of each quadrant, supporting data-driven decision-making in investor pitches and executive briefings.
-
How to Use
Enter business data, analysis results, or key messages into each circular element's title (VALUE 01–04) and the surrounding text boxes on both sides. Choose the color combination that matches your corporate brand guidelines—either the blue and gray or red and gray version—to maintain visual consistency throughout your presentation.
-
Recommended For
Ideal for executives, business strategists, marketing managers, and investor relations professionals presenting business strategy, market analysis, competitive positioning, or customer segmentation. Fits seamlessly into company profiles, business plans, investor decks, and marketing strategy presentations.
-
Slide Structure
The 2-slide set features a title area at the top, four circular diagram elements arranged in the center, and four text explanation boxes positioned on the left and right sides. Slide 1 uses the blue and gray color scheme, while Slide 2 offers the red and gray alternative for flexible brand alignment.
Related Products
-

Business Value Diagram – Visualizing Business Sectors
#Company Introduction #Business Introduction #Diagram
-

Management Business Area Diagram – Effective Business Introduction
#Company Introduction #Business Introduction #Diagram
-

Business Ideas Area Circular Diagram
#Company Introduction #Business Introduction #Diagram
-

Business Gradient Diagram – Visualizing Business Areas and Fields
#Company Introduction #Business Introduction #Diagram
