Setting Target Area Goals in the United States – Strategic Analysis through Market Research
RJ0400060_26
- Last Update 06/03/2025
- File Size 0.4MB
- # of Slides 2
- File Format PPTX
- Slide Ratio 16:9
- Color
Keywords
- #Content-Based Slides
- #Design-Based Slides
- #Market and Competitor Analysis
- #Marketing Plan and Strategy
- #Other
- #Target Market
- #Target Market Strategy
- #16:9
- #US market analysis PowerPoint slide
- #regional target setting presentation
- #market comparison slide
- #competitive analysis PPT
- #marketing strategy map slide
About the Product
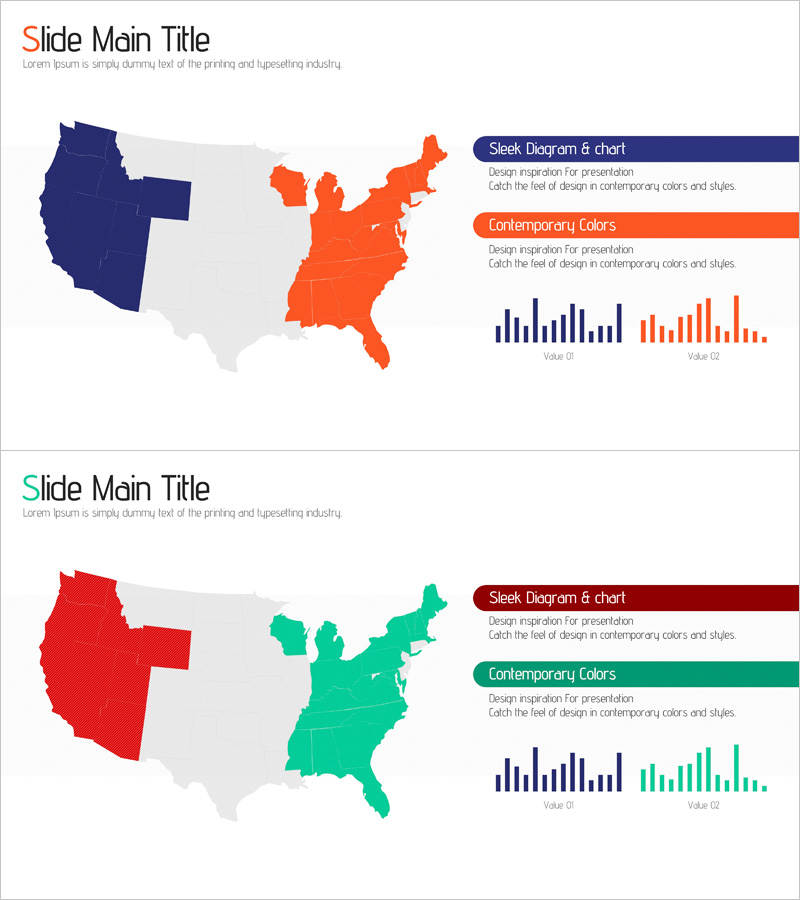
A PowerPoint slide designed for establishing regional target goals in US market entry strategy. This presentation resource uses a US map for visual comparative analysis, allowing you to understand market conditions across Eastern and Western regions at a glance. The navy and orange dual-tone color scheme clearly distinguishes the characteristics of two regions, while bar charts intuitively express quantitative data. This slide is optimized for presenting evidence-based regional target setting during marketing strategy development, competitive analysis, and investment decision-making phases. Formatted in 16:9 widescreen with 2 slides in editable PPTX format.
Usage Points
-
Main Usage
This slide presents evidence-based regional target setting when entering the US market. By comparing Eastern and Western regional market conditions through maps and charts, it supports decision-making and enables clear definition of regional target markets during competitive analysis and marketing strategy planning phases.
-
How to Use
Apply this slide to the market analysis section of business plans, investment pitch decks, and marketing proposals. Input regional market share, revenue, or customer numbers in the map areas, and add competitor data or growth rates to charts to emphasize regional strategy differences. During presentations, use this layout to sequentially explain each region's characteristics and targets.
-
Recommended For
Marketing managers, business development teams, and executives use this when establishing regional market strategies. It is particularly valuable for US market entry companies presenting business plans, investor pitches, and internal strategy meetings to demonstrate the validity of regional target setting.
-
Slide Structure
Composed of 2 slides, each divided into a US map (left side) and explanation area (right side). The map displays 2 regions in contrasting colors, while the right side contains 2 region name and characteristic description text boxes plus 2 bar charts (Value 01, Value 02), creating a clear comparative analysis structure.
Related Products
-

Introducing the US Target Region Strategy – Market Analysis and Marketing Plan
#Market and Competitor Analysis #Marketing Plan and Strategy #Other
-

Target Area Status Analysis Graph
#Market and Competitor Analysis #Marketing Plan and Strategy #Graph
-

US Target Market Analysis Map
#Market and Competitor Analysis #Marketing Plan and Strategy #Other
-

European Target Area Goals – Market and Marketing Strategy Analysis
#Market and Competitor Analysis #Marketing Plan and Strategy #Other
