Introducing the US Target Region Strategy – Market Analysis and Marketing Plan
RJ0400048_17
- Last Update 05/30/2025
- File Size 0.6MB
- # of Slides 2
- File Format PPTX
- Slide Ratio 16:9
- Color
Keywords
- #Content-Based Slides
- #Design-Based Slides
- #Market and Competitor Analysis
- #Marketing Plan and Strategy
- #Other
- #Target Market
- #Target Market Strategy
- #16:9
- #US regional strategy PowerPoint slide
- #target market analysis presentation
- #regional marketing strategy slide
- #US map chart PowerPoint
- #market analysis infographic
About the Product
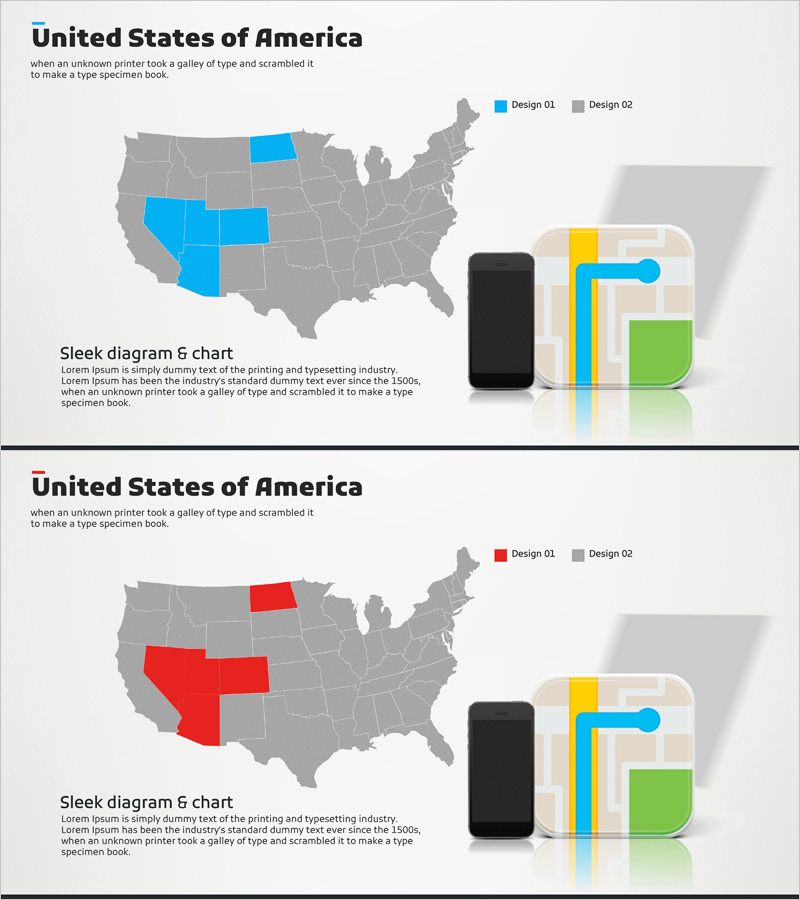
A 2-slide PowerPoint presentation for visualizing US market analysis and regional marketing strategy. The slide features a US map with region-specific highlighting in blue or red, paired with colorful data charts and infographics on the right side. The gray background map clearly marks target regions, while the right panel displays a black device mockup combined with yellow, blue, and green chart elements to represent regional data. This presentation slide is ready to use in strategy reports, marketing plans, and business proposals for the market analysis section.
Usage Points
-
Main Usage
This slide combines map visualization and data charts to present US regional target strategy and marketing plans at a glance. It clearly demonstrates regional-based strategy rationale and execution plans to investors, partners, and internal teams.
-
How to Use
Use in the market analysis section of business plans, marketing proposals, and investment pitch decks to explain regional target market conditions. Customize the highlighted regions on the map and replace the right-side chart data to match your actual strategy content.
-
Recommended For
Marketing managers, business strategy teams, sales directors, and executives preparing regional market analysis presentations will find this slide valuable. It is especially suitable for US market entry strategies, regional expansion plans, and target customer segment analysis presentations.
-
Slide Structure
The 2-slide set features a blue-highlighted regional map on the first slide and a red-highlighted regional map on the second. Each slide's right side displays a black device mockup with yellow, blue, and green bar charts and infographic elements representing regional data. Text input areas are streamlined with title and description sections for clean composition.
Related Products
-

US Target Area Map – Marketing Strategy Development
#Market and Competitor Analysis #Marketing Plan and Strategy #Other
-

US Target Market Analysis – Strategic Insights
#Market and Competitor Analysis #Marketing Plan and Strategy #Other
-

Business USA Target Market Analysis – Predicting the Future with Data
#Market and Competitor Analysis #Marketing Plan and Strategy #Other
-

Analysis of the US Target Map – Target Market Strategy
#Market and Competitor Analysis #Marketing Plan and Strategy #Other
