Profit and Loss Analysis Table – Clearly Presenting Financial Performance
RJ0400058_19
- Last Update 06/02/2025
- File Size 0.1MB
- # of Slides 2
- File Format PPTX
- Slide Ratio 16:9
- Color
Keywords
- #Content-Based Slides
- #Design-Based Slides
- #Financial Plans and Performance
- #Diagram
- #Income Statement
- #Sales and Revenue
- #Table
- #16:9
- #profit and loss table PowerPoint
- #financial table slide design
- #income statement PPT template
- #3-column comparison table
- #how to create financial data table in PowerPoint
About the Product
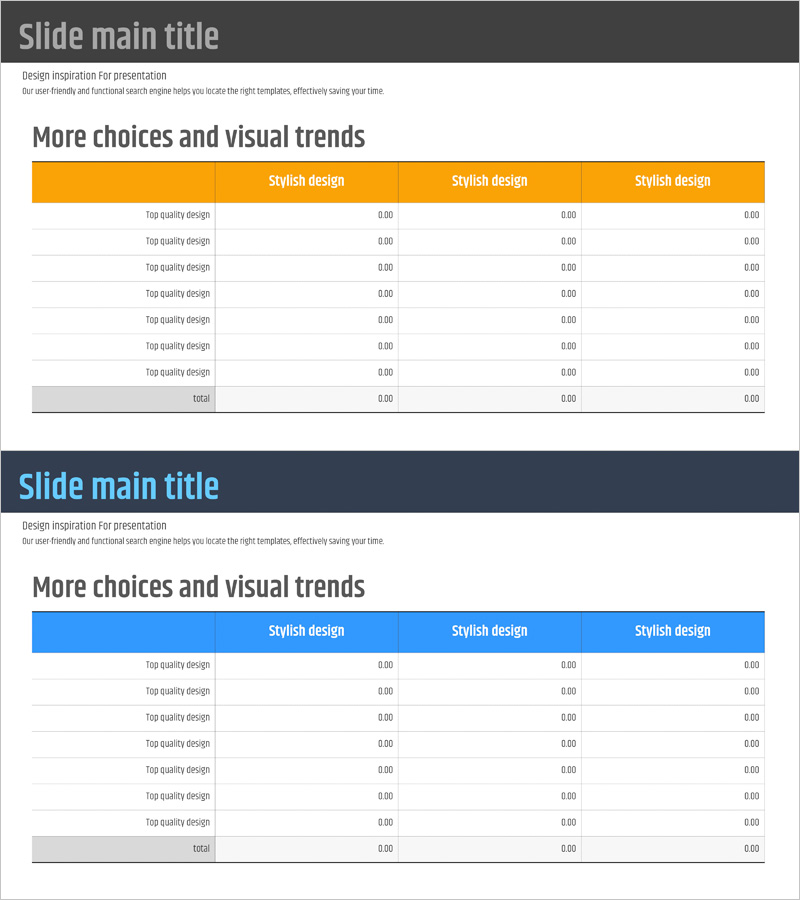
A professional profit and loss analysis table PowerPoint slide designed to clearly present financial performance metrics. This slide deck includes two design versions featuring orange and blue header styles, each with a 3-column comparison structure for effective financial data visualization. The layout provides clearly defined row items and numeric input areas, making it immediately applicable to financial statements, performance reports, and investor presentations. Delivered in 16:9 widescreen PPTX format with fully editable text and data fields, allowing you to seamlessly input your company's actual financial figures and customize row labels and column headers.
Usage Points
-
Main Usage
Clearly communicate financial performance metrics in tabular format and enable intuitive comparison of profit and loss data across multiple periods or departments. Provides credible data visualization for financial presentations to investors, shareholders, and executives.
-
How to Use
Enter your actual profit and loss figures (revenue, cost of goods sold, net income, etc.) directly into the table cells. Select either the orange or blue header version to match your corporate brand colors, and customize row labels and column titles as needed to create a tailored financial analysis table.
-
Recommended For
Ideal for CFOs, finance managers, and executives presenting quarterly or annual financial performance. Particularly useful in investor relations materials, business plans, investment proposals, and financial consulting presentations where profit and loss trends and financial metrics require comparative analysis.
-
Slide Structure
Two-slide composition with each slide containing one title area and one table measuring 3 columns by 8 rows. The header row is highlighted in either orange or blue, data rows feature white backgrounds with 0.00 numeric input fields, and the final row serves as the total summary row.
Related Products
-

Mobile Finance Business Sales and Profit Statement – Transparent Financial Performance
#Financial Plans and Performance #Diagram #Income Statement
-

Sales and Profit Table Diagram
#Financial Plans and Performance #Diagram #Income Statement
-

Profit and Loss Statement Slide – Calculating Investment Business Sales and Profits
#Financial Plans and Performance #Diagram #Income Statement
-

Affiliate Business Income Statement – Visualizing Financial Performance
#Financial Plans and Performance #Diagram #Income Statement
