Global User Count Analysis Graph – Insights on Market Trends
RJ0400054_21
- Last Update 06/01/2025
- File Size 0.6MB
- # of Slides 2
- File Format PPTX
- Slide Ratio 16:9
- Color
Keywords
- #Content-Based Slides
- #Design-Based Slides
- #Market and Competitor Analysis
- #Marketing Plan and Strategy
- #Graph
- #Other
- #Customer Analysis
- #Target Market Strategy
- #16:9
- #global user analysis PowerPoint
- #regional market analysis slide
- #bubble chart presentation
- #market trend graph template
- #global customer distribution deck
About the Product
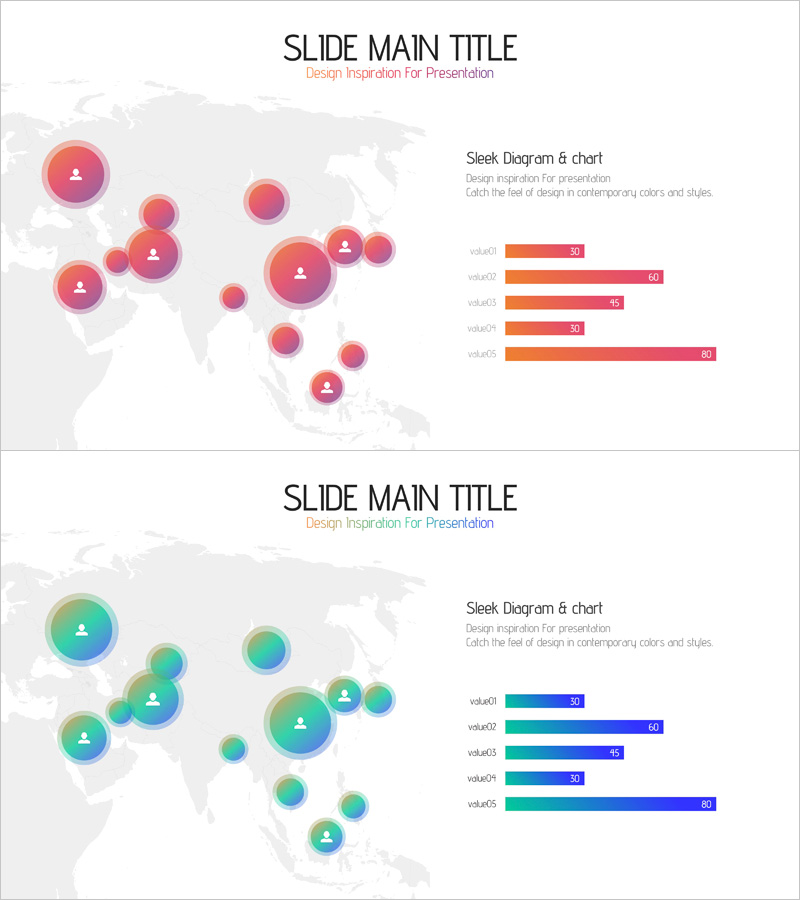
An essential PowerPoint slide for presenting global market expansion strategies with regional user distribution analysis. The slide features a world map with bubble chart visualization showing user concentration by region, complemented by horizontal bar graphs on the right displaying quantitative data. Orange-to-pink gradient bubbles intuitively convey regional market size, enabling investors, executives, and marketing teams to quickly identify market opportunities. Two-slide set with color variations (orange-pink and teal-blue) allows you to match your presentation theme while maintaining consistent data visualization.
Usage Points
-
Main Usage
Optimized for analyzing global market conditions by regional user scale and visualizing market opportunities. Supports data-driven decision-making in investor pitch presentations, business strategy planning, and marketing plan development.
-
How to Use
Adjust bubble sizes on the world map to match actual user counts and input values into the right-side bar graph. Select the color variation that best fits your presentation theme from the two provided options to create a cohesive presentation.
-
Recommended For
Recommended for executives developing global expansion strategies, marketing teams preparing market analysis reports, business development professionals presenting investor relations pitches, and consultants explaining international business performance.
-
Slide Structure
The slide combines a world map on the left with five regional bubbles (size and color represent user scale) and horizontal bar graphs on the right (five data items with quantitative values). Includes title and subtitle areas with ample text space for adding analysis insights and conclusions.
Related Products
-

Modern Business Presentation Template Map – Global Marketing Analysis
#Market and Competitor Analysis #Marketing Plan and Strategy #Graph
-

Comparative Chart of Male and Female Professionals
#Market and Competitor Analysis #Graph #Other
-

Horizontal Bar Charts for Customer Analysis – Summer Vacation Template
#Market and Competitor Analysis #Graph #Other
-

Professional Technology Talent Analysis Slide – Operations Plan and Customer Analysis
#Operational Plan #Market and Competitor Analysis #Graph
