Introduction to Big Data Analysis Program – Innovation and Growth
RJ0400053_9
- Last Update 06/01/2025
- File Size 0.8MB
- # of Slides 2
- File Format PPTX
- Slide Ratio 16:9
- Color
Keywords
- #Content-Based Slides
- #Design-Based Slides
- #Product/Service Introduction
- #Business Vision and Strategy
- #Diagram
- #Program Introduction
- #Business Goals
- #Cluster
- #Closed Cluster Diagram
- #16:9
- #circular text box PowerPoint
- #3-item emphasis slide
- #PowerPoint circular boxes
- #key points presentation
- #dual-tone color PPT slide
About the Product
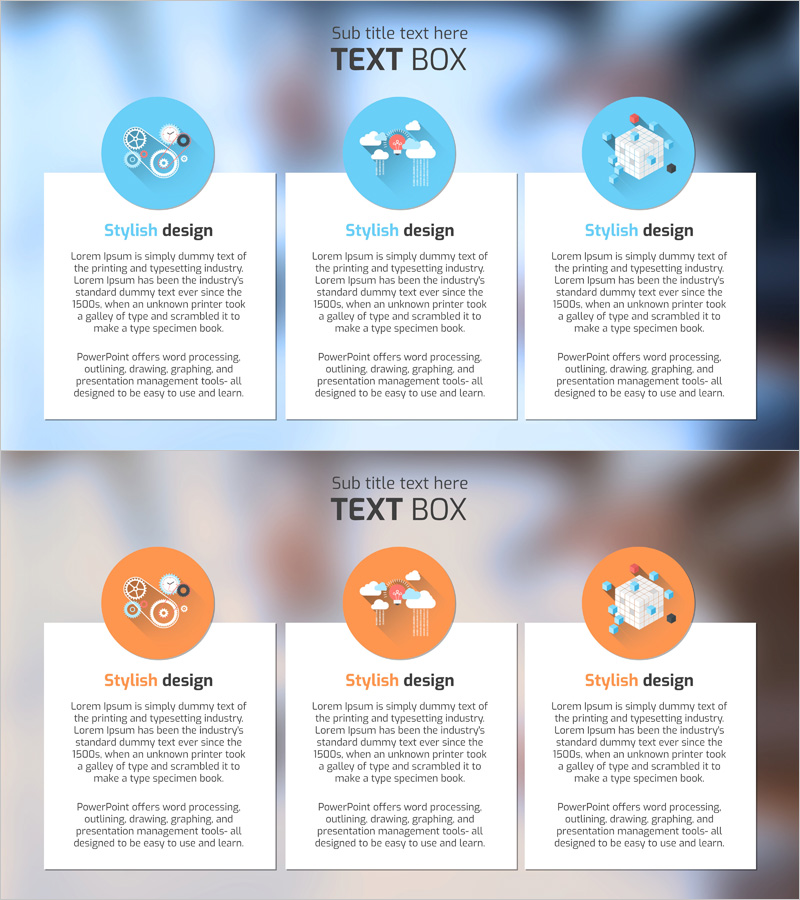
A PowerPoint slide featuring three circular text boxes designed to visually organize key content and messages. The slide uses a dual-tone color scheme combining blue and orange, with each circular box containing space for icons and text. This layout is ideal for emphasizing three main points, stages, or features in your presentation. The 2-slide set provides both blue-background and orange-background themes, allowing you to match your document's overall tone and style. Fully editable in PPTX format, enabling you to customize text, icons, and colors to fit your specific presentation needs.
Usage Points
-
Main Usage
Use this slide when you need to highlight three main topics or stages with equal emphasis in your presentation. Each circular box functions as an independent section while maintaining overall visual balance, making it perfect for explaining product features, business objectives, implementation strategies, or any three-part parallel structure.
-
How to Use
Edit the text and icons within each circular box to match your presentation content. Apply the blue-background slide for corporate or technology-focused topics, and the orange-background slide for creative or innovation-themed presentations. Select the appropriate background color to maintain consistency with your overall presentation design.
-
Recommended For
Ideal for business plans, product introductions, marketing proposals, technical presentations, and educational seminars where three key points need clear emphasis. Recommended for executives, marketing teams, technical specialists, and educators presenting important information to stakeholders.
-
Slide Structure
The 2-slide set features three circular text boxes on each slide. Slide 1 displays three light-blue circular boxes on a blue background, while Slide 2 shows three orange circular boxes on a neutral background. Each circular box includes an icon area at the top, a title section in the center, and a description text area at the bottom for customization.
Related Products
-

Ringer Shape Subdivided Column Graph for Global Trade Business Objectives
#Product/Service Introduction #Business Vision and Strategy #Diagram
-

Introduction to the Financial Business Program – A Differentiated Strategic Approach
#Product/Service Introduction #Business Vision and Strategy #Diagram
-

Business Goal Diagram – A Fresh Vision for Financial Planning
#Product/Service Introduction #Business Vision and Strategy #Diagram
-

3 Steps to Setting Business Goals Diagram Slide
#Product/Service Introduction #Business Vision and Strategy #Diagram
