Market Trend Analysis Area Graph – Market and Competitive Analysis
RJ0400049_29
- Last Update 05/30/2025
- File Size 0.2MB
- # of Slides 2
- File Format PPTX
- Slide Ratio 16:9
- Color
Keywords
About the Product
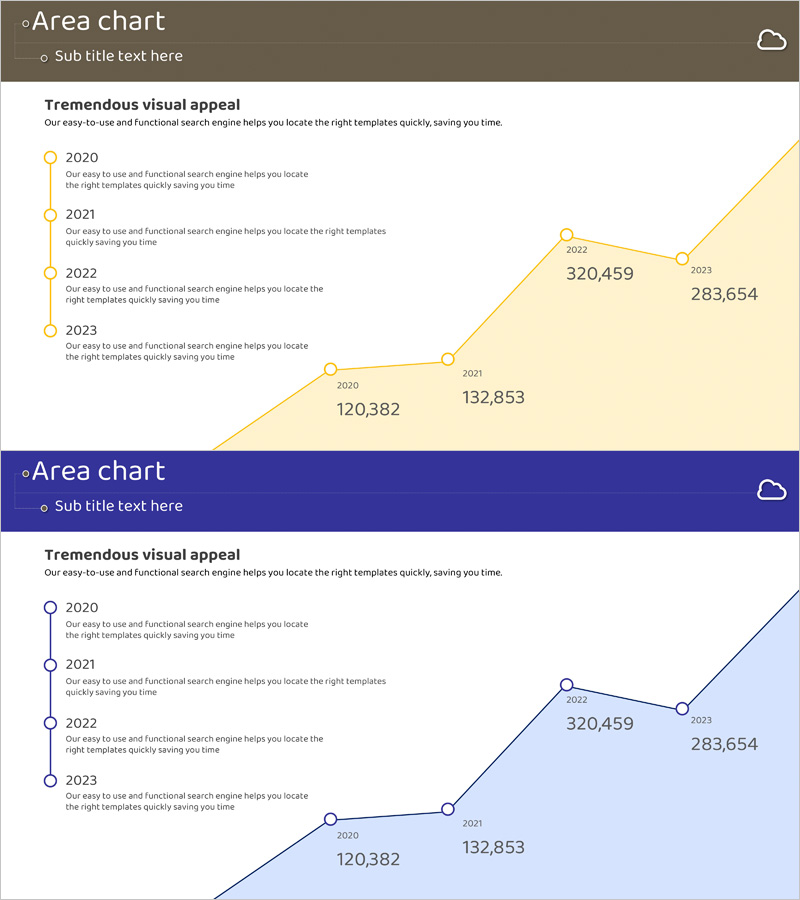
A PowerPoint area chart slide visualizing market growth from 2020 to 2023 with dual color schemes in beige and navy. The layout combines a left-side timeline marker with a right-side area chart, enabling clear display of year-over-year numerical data. This slide effectively communicates market trends and competitive positioning for investor presentations, business reports, and market analysis sections. The structured design accommodates multiple data points while maintaining visual clarity. Fully editable PPTX format allows quick customization of colors, fonts, and data values.
Usage Points
-
Main Usage
Visualizes year-over-year market growth and competitive performance through numerical data representation. The area chart format enables intuitive comparison of market share changes and revenue growth rates, providing clear decision-making support for stakeholders.
-
How to Use
Enter years on the left timeline and input actual data values into the right area chart. The beige version suits warm-toned presentations while the navy version works for formal investor relations materials. Customize colors and fonts through the slide master for brand alignment.
-
Recommended For
Executive reports, investor relations presentations, business performance analysis sections, and market overview materials. Particularly effective when comparing 3+ years of growth data or emphasizing competitive advantages over rivals.
-
Slide Structure
Two-slide set with each slide featuring a left text area (4 year/description fields) and right area chart (4 data points with numerical labels). Timeline markers visually connect to the chart area, clearly expressing temporal progression and trend changes.
Related Products
-

Five Color Powerpoint Template Wide – Charts and Mockups
#Market and Competitor Analysis #Graph #Other
-

100% Stacked Bar Chart Abstract Pattern Presentation
#Market and Competitor Analysis #Graph #Other
-

Trends in Usage by Transportation Type – Market Trend Analysis
#Market and Competitor Analysis #Graph #Other
-

Management System and Area Charts – Effective Business Strategies
#Business Strategy #Market and Competitor Analysis #Diagram
