Shopping Payment Comparison Hill Shape Graph – Essential Market Analysis Item
RJ0400046_8
- Last Update 05/29/2025
- File Size 0.6MB
- # of Slides 2
- File Format PPTX
- Slide Ratio 16:9
- Color
Keywords
About the Product
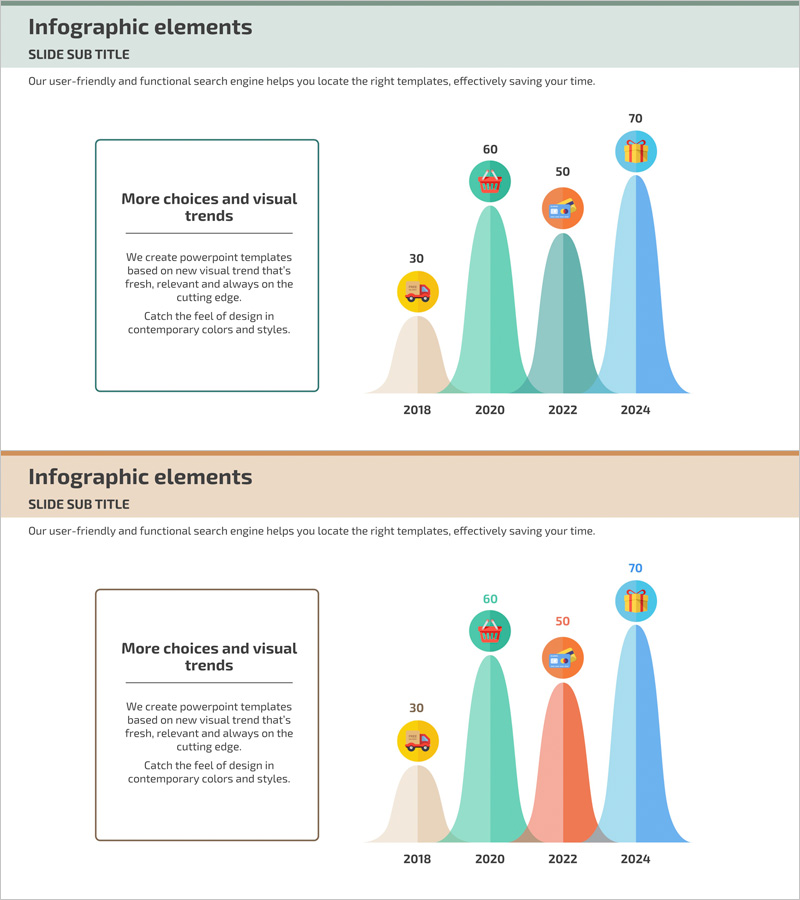
A PowerPoint slide optimized for market analysis and data comparison using a hill-shaped graph visualization. This presentation template displays trends from 2018 to 2024 across four color categories (beige, green, gray, and blue), with numeric icons for each year to clarify information hierarchy. The left text box accommodates key messages, making it suitable for market trends, competitive analysis, customer preference shifts, and various comparative studies. Available in 16:9 widescreen PPTX format for immediate editing and insertion into your presentation materials.
Usage Points
-
Main Usage
Communicate comparative data over time—such as market conditions, competitive positioning, customer preference evolution, and sales trends—in an intuitive visual format. The hill-shaped curves enable instant recognition of relative magnitudes and change patterns, providing clear decision-making support.
-
How to Use
Enter your analysis topic in the left text box (e.g., payment method comparison, market share evolution) and replace the numeric values with your actual data. Colors can remain consistent with categories or be customized to match your corporate brand palette.
-
Recommended For
Ideal for marketing plans, business reports, investor presentations, and market analysis briefings. Recommended for professionals in marketing, planning, sales, and executive roles who need to present data-driven insights, especially when comparing multiple items or showing year-over-year trends.
-
Slide Structure
Comprises a title area at the top, a left text input box (3 lines), and a right hill-shaped graph section with four curves, four year labels, and four numeric icons. The balanced layout of text and chart achieves both effective information delivery and visual impact.
Related Products
-

Laptop Mockup Bar Graph – Essential Slide for Competitor Analysis
#Market and Competitor Analysis #Graph #Other
-

Segmented Square 3D Graph: Market & Competitive Analysis
#Market and Competitor Analysis #Graph #Other
-

Three-Dimensional Graph Analysis – Market and Competitor Analysis Slide
#Product/Service Introduction #Market and Competitor Analysis #Marketing Plan and Strategy
-

Spaceship Launch Analysis Graph – Ideal for Competitor Analysis
#Market and Competitor Analysis #Diagram #Graph
