Infographic for Weather Comparison – Stylish Design
RJ0400044_5
- Last Update 05/29/2025
- File Size 0.5MB
- # of Slides 2
- File Format PPTX
- Slide Ratio 16:9
- Color
Keywords
- #Content-Based Slides
- #Design-Based Slides
- #Product/Service Introduction
- #Marketing Plan and Strategy
- #Diagram
- #Differentiation Strategy for Products/Services
- #Marketing Strategy
- #Cluster
- #Chain Diagram
- #16:9
- #radial infographic PowerPoint
- #weather comparison slide
- #connection diagram PowerPoint
- #infographic slide template
- #data visualization presentation
About the Product
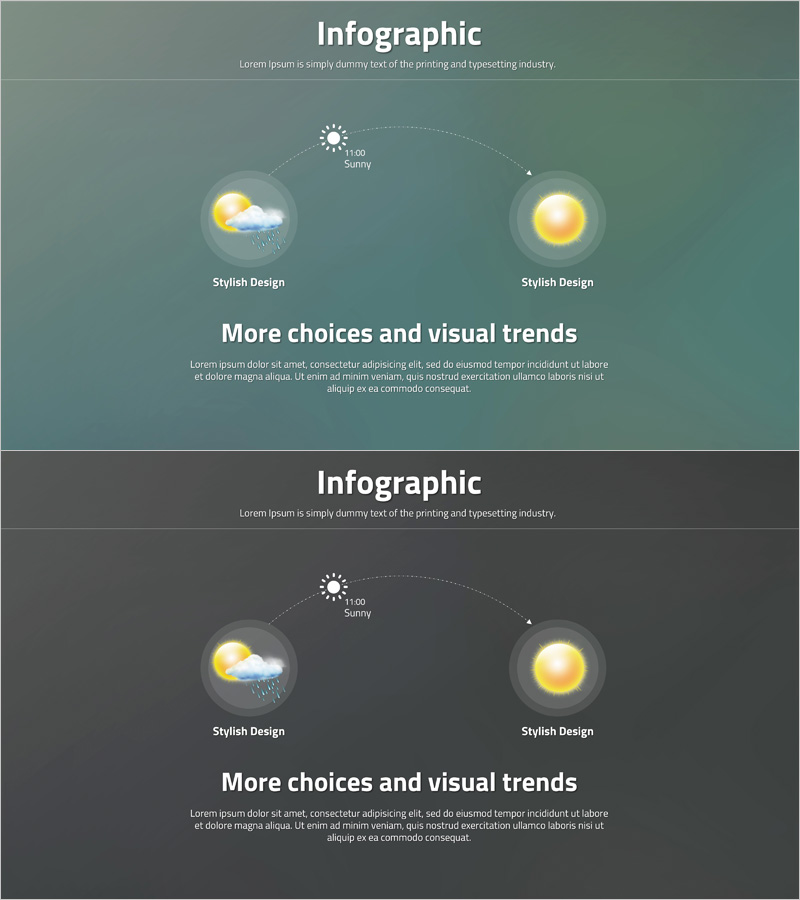
A radial infographic PowerPoint slide featuring a central sun icon with branching connections extending left and right to compare weather data. The design uses circular nodes to represent cloudy and sunny conditions, creating a clear visual hierarchy for information comparison. Set against a sage green background with golden weather icons and white typography, this presentation slide delivers strong visual contrast and information clarity. The 2-slide set is ready for immediate use in various presentation contexts.
Usage Points
-
Main Usage
Visualizes weather data, climate information, and environmental analysis by expanding from a central concept to multiple related items. The radial structure clearly expresses relationships between core topics and detailed elements, functioning as a comparative analysis slide for presentations.
-
How to Use
Replace the central sun icon with your main topic and add comparison items to the left and right circular nodes. Customize text and icons to apply to climate change, regional weather comparisons, seasonal analysis, and other data comparison scenarios.
-
Recommended For
Ideal for meteorological reports, environmental impact assessments, regional development plans, tourism marketing, educational seminars, and climate change presentations. Recommended for professionals including meteorologists, environmental specialists, educators, and marketing managers who need to express information comparison and connection relationships.
-
Slide Structure
2-slide set. Each slide features a central sun icon (1 primary node) with 3-directional branching connections. The structure includes 2 circular nodes (left: cloudy weather, right: sunny weather), dotted connection lines, and time-stamp text. Sage green background with golden accent colors creates visual emphasis.
Related Products
-

Business Service Differentiation Strategy Diagram – Cluster Approach for Effective Marketing
#Product/Service Introduction #Marketing Plan and Strategy #Diagram
-

Parenting Education Diagram – Product/Service Introduction and Marketing Strategy
#Product/Service Introduction #Marketing Plan and Strategy #Diagram
-

Science Experiment Marketing Strategy Slide Template
#Product/Service Introduction #Marketing Plan and Strategy #Diagram
-

Weather Change Diagram – Product and Service Differentiation
#Product/Service Introduction #Marketing Plan and Strategy #Diagram
