Slide Template for Visualizing Key Weather Data
RJ0400044_19
- Last Update 05/29/2025
- File Size 2.1MB
- # of Slides 2
- File Format PPTX
- Slide Ratio 16:9
- Color
Keywords
- #Content-Based Slides
- #Business Vision and Strategy
- #Business Strategy
- #Business Background and Necessity
- #Project Progress
- #16:9
- #weather data visualization PowerPoint
- #weather forecast presentation slide
- #meteorological data PPT slide
- #business weather information template
- #how to visualize weather data in PowerPoint
About the Product
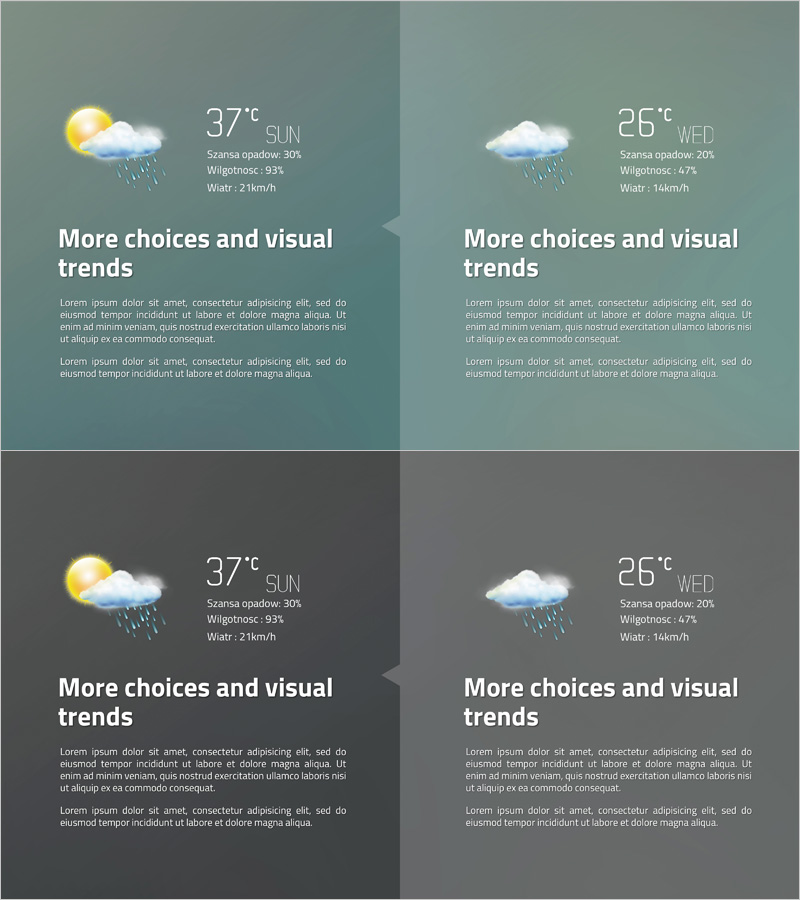
A 2-slide PowerPoint set designed to effectively communicate weather information and forecasts in business presentations. The left slide displays temperature, cloud coverage, humidity, and wind speed data using weather icons (sunny and rainy), while the right slide presents rainfall forecast information. The green-toned background with white typography and weather icons enhances data visualization clarity. Each slide features separate text and data display areas for flexible editing to match your presentation content. This PPT slide set is ready to use in business reports, marketing materials, and project presentations that require weather-related data.
Usage Points
-
Main Usage
Communicate meteorological information, weather forecasts, and climate data in business presentations. Visually represent weather indicators such as temperature, humidity, wind speed, and cloud coverage to enhance audience comprehension and convey weather-related decision-making information clearly.
-
How to Use
Edit the text areas on each slide with your presentation content and modify data figures as needed. The left slide suits current weather situation descriptions, while the right slide is ideal for presenting forecast information. The green background complements nature, environment, and climate-related topics effectively.
-
Recommended For
Recommended for meteorological reports, environmental impact assessments, agriculture and fisheries business plans, tourism and leisure industry marketing, climate change analysis presentations, and disaster prevention educational materials. Suitable for data-driven decision-making presentations in various industry sectors.
-
Slide Structure
2-slide layout with each slide divided into three sections: top weather icon area (displaying temperature, cloud coverage, humidity, wind speed), center title text area, and bottom description text area. Left slide emphasizes mixed sunny-rainy icons, right slide focuses on rainfall forecast with distinct information hierarchy.
Related Products
-

Modern Business Background and Necessity – Slide Illustrating Business Strategy Flow
#Business Vision and Strategy #Business Strategy #Diagram
-

Business Background and Progress Diagram - Blue and Red
#Business Vision and Strategy #Business Strategy #Diagram
-

Comparison of Temperature Differences by Weather - Business Vision and Strategy
#Business Vision and Strategy #Business Strategy #Business Background and Necessity
-

Color Theme Presentation Template for Line Charts
#Business Strategy #Market and Competitor Analysis #Graph
