Space Business History Connection Diagram – Journey to the Future
RJ0400035_4
- Last Update 05/27/2025
- File Size 13.5MB
- # of Slides 2
- File Format PPTX
- Slide Ratio 16:9
- Color
Keywords
About the Product
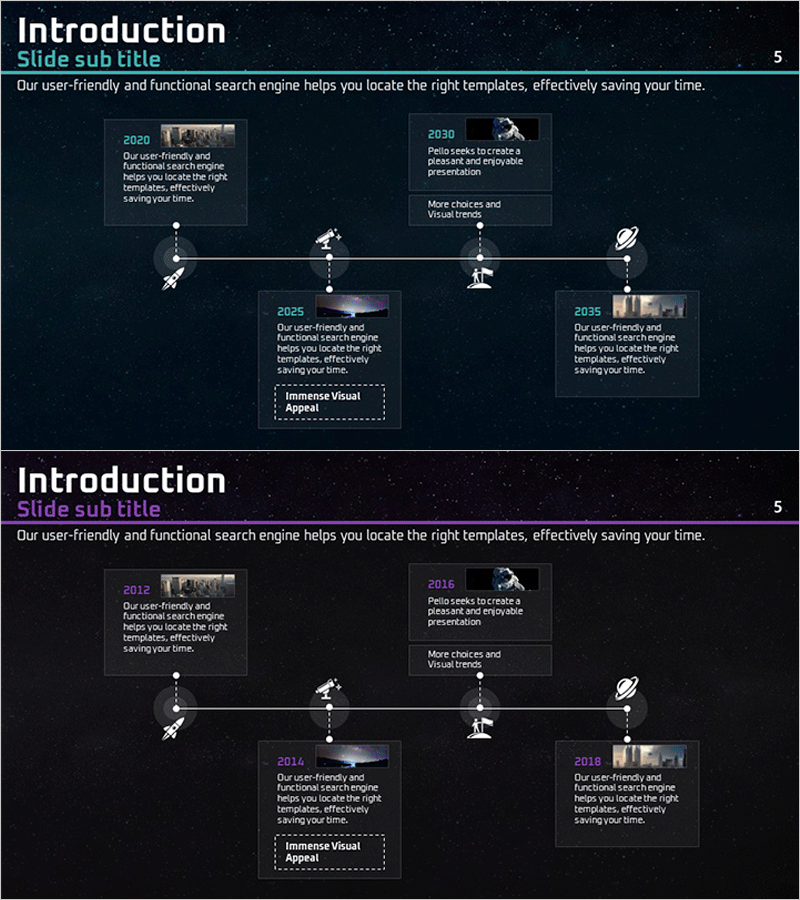
A 4-node connection diagram PowerPoint slide that links the past and future of space business development. Designed with a dark navy background, cyan accent lines, and white typography, each node accommodates an image and descriptive text. The horizontal timeline structure intuitively represents business evolution stages over time, with dotted connectors and icons emphasizing key milestones at each phase. This slide deck is ideal for business presentations explaining company history, technological advancement, project evolution, and strategic growth. The 16:9 widescreen format includes 2 fully editable slides ready for immediate customization.
Usage Points
-
Main Usage
Optimized for visualizing company history, technological advancement, project evolution, and business expansion stages in chronological order. Each node accommodates images and descriptions, allowing simultaneous representation of past achievements and future vision. Enhances credibility in investor presentations and corporate introduction decks.
-
How to Use
Insert representative images for each period into the image areas of each node, and enter the year and key achievements in the text boxes. The dotted connectors and icons remain fixed, so only text and images need replacement. Color adjustments can be made through shape formatting options for line colors and background fills.
-
Recommended For
Suitable for company introductions and history presentations in aerospace, energy, and technology industries; startup growth stage presentations; government policy implementation explanations; and academic presentations of research progression. Applicable to executive reports, investor pitch decks, and corporate promotional materials.
-
Slide Structure
2-slide composition with the first slide displaying a title and 4-node connection diagram. Each node features a dedicated image area (approximately 80×80px) and text input section, connected horizontally via dotted lines on a timeline. The second slide presents a variant layout with emphasis boxes and additional explanation areas for expanded content.
Related Products
-

Fountain Pen History Diagram – Emphasizing Corporate Identity
#Company Introduction #Product/Service Introduction #Diagram
-

Business History Connection Diagram – Company Growth Story
#Company Introduction #Diagram #History
-

Silhouette History Diagram – Visualizing Evolution
#Company Introduction #Diagram #Other
-

Introduction to the History of the Architectural Company – A Visual Timeline
#Company Introduction #Diagram #Company Overview
