Diagram Slide Visualizing the Process of Tooth Decay – Essential for Operational Planning
RJ0400034_11
- Last Update 05/26/2025
- File Size 2.5MB
- # of Slides 2
- File Format PPTX
- Slide Ratio 16:9
- Color
Keywords
- #Content-Based Slides
- #Design-Based Slides
- #Operational Plan
- #Diagram
- #Business Processes
- #Cluster
- #Chain Diagram
- #16:9
- #radial diagram PowerPoint
- #connection diagram slide
- #7-node diagram template
- #centrifugal process diagram
- #organizational structure PowerPoint
- #how to create radial diagram in PowerPoint
About the Product
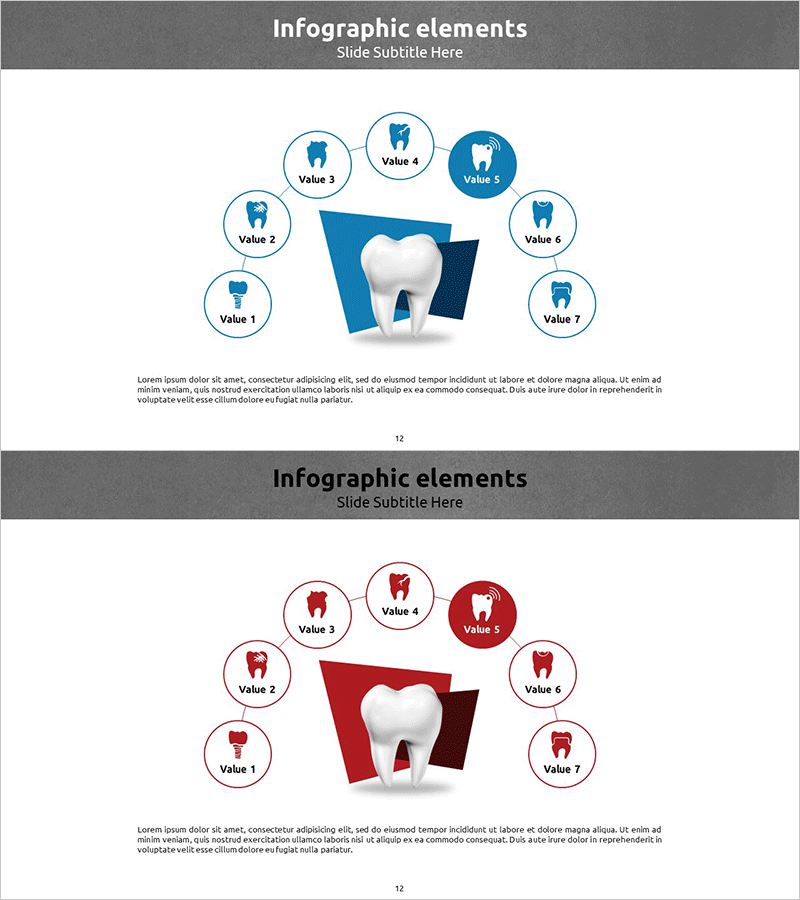
A PowerPoint slide featuring a central core element with seven circular nodes radiating outward in a symmetrical pattern. Available in two color versions—blue and red—each node includes an icon placeholder and text input area for customization. This design effectively visualizes process flows, organizational hierarchies, core values, team responsibilities, and product features that expand from a central concept. The 16:9 widescreen format includes two fully editable slides ready for immediate use in presentations, business proposals, and strategic planning documents.
Usage Points
-
Main Usage
Illustrates how a central strategy, value, or concept branches into seven interconnected departments, functions, or outcomes. Ideal for showing hierarchical relationships, process dependencies, product feature ecosystems, or how a core initiative cascades into multiple implementation areas.
-
How to Use
Enter your central concept (company name, strategy, product) in the large center shape. Fill the seven surrounding nodes with corresponding details, customizing icons and text to match your presentation content. Select either the blue or red color version to align with your brand identity, then edit all text fields directly in PowerPoint.
-
Recommended For
Executive presentations, strategic planning documents, organizational structure explanations, product launch decks, marketing proposals, business plans, team role definitions, process improvement initiatives, and stakeholder communications where central-to-peripheral relationships need clear visual representation.
-
Slide Structure
Central 3D-effect shape surrounded by seven evenly-distributed circular nodes. Each node contains an icon area and text field, connected to the center by linking lines. Two complete slides provided: one in deep blue and one in deep red, both fully customizable in 16:9 widescreen format.
Related Products
-

Step-by-Step Work Process Connection Diagram – Clear Visualization for Business Strategy
#Business Strategy #Operational Plan #Diagram
-

Joint Business Process – Efficient Operational Planning
#Product/Service Introduction #Operational Plan #Diagram
-

Color Cosmetic Process Diagram – Visualizing Business Strategy
#Business Strategy #Operational Plan #Diagram
-

Sports Illustration and Connection Diagram – Motivational Theme
#Business Strategy #Operational Plan #Diagram
