Childcare Costs and Inventory Diagram - Practical Example
RJ0400030_16
- Last Update 05/25/2025
- File Size 8.7MB
- # of Slides 2
- File Format PPTX
- Slide Ratio 16:9
- Color
Keywords
About the Product
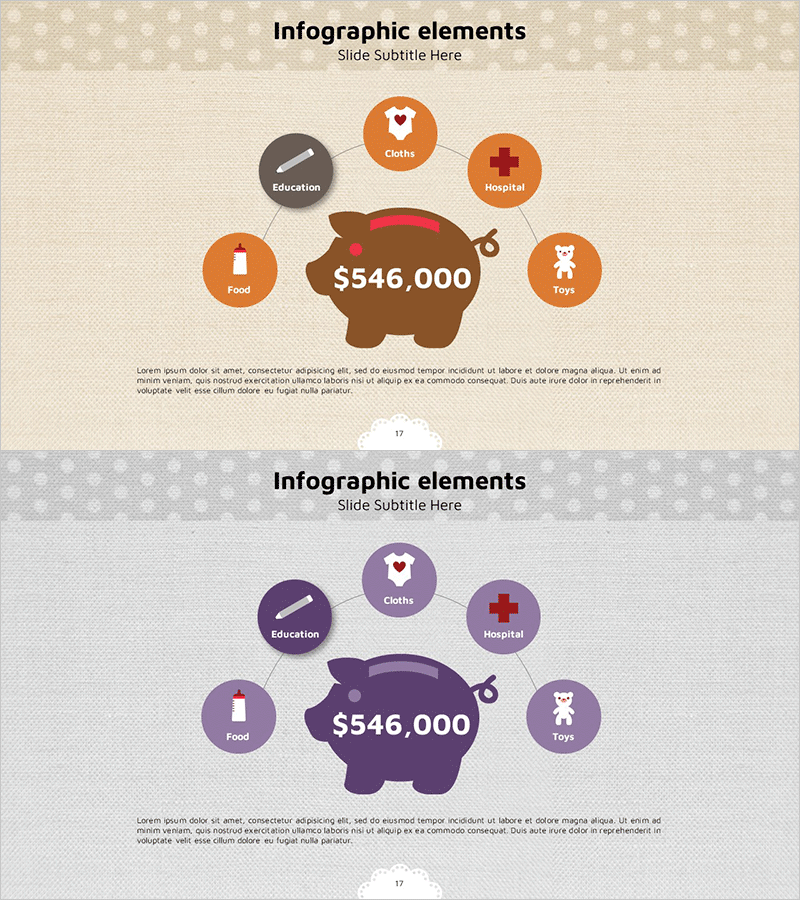
A radial infographic diagram PowerPoint slide that visualizes childcare cost composition with a central piggy bank icon radiating to six expense categories: Education, Clothes, Hospital, Toys, Food, and Others. The warm color palette combines orange and brown tones, creating a family-friendly atmosphere with intuitive category icons for each expense type. The 2-slide set includes color variations (orange-brown and purple-mauve) to match different presentation contexts. Delivered in 16:9 widescreen PPTX format with fully editable elements, this slide deck is ideal for childcare cost analysis, household budget presentations, family finance planning, and childcare-related business introductions.
Usage Points
-
Main Usage
This central hub radial diagram is designed to visually analyze and explain childcare expense composition. The structure radiates from a central total amount ($546,000) to six cost categories—Education, Clothes, Hospital, Toys, Food, and Others—enabling audiences to instantly grasp the relationship and proportion of each expense item.
-
How to Use
Use this slide in childcare cost analysis presentations, household budget explanations, childcare business pitches, childcare service planning documents, family financial planning seminars, and parenting cost education workshops. Edit the text labels and numerical values in each circular node to match your actual data and customize for your specific presentation needs.
-
Recommended For
Ideal for childcare product companies, childcare service providers, family financial consultants, educational institutions, government policy officials, childcare-related business professionals, family budget management educators, and parenting cost analysis specialists.
-
Slide Structure
A radial layout with a central brown piggy bank icon displaying the key figure ($546,000), surrounded by six circular nodes positioned in cardinal and diagonal directions, each containing a category icon. The 2-slide set provides two color scheme variations: orange-brown and purple-mauve tones for flexible presentation design.
Related Products
-

Business Structure Diagram – Visualizing Business Areas
#Product/Service Introduction #Business Introduction #Diagram
-

Healthcare Business Infrastructure Diagram – Visualizing Business Areas
#Business Introduction #Diagram #Business Areas
-

Circular Puzzle Diagram – Infographic for Business Introduction
#Company Introduction #Business Introduction #Diagram
-

Pentagonal Star Business Area Diagram – Visual Appeal and Insight
#Company Introduction #Business Introduction #Diagram
