IT Service Business Progress and Outlook – Roadmap to Success
RJ0400028_17
- Last Update 05/25/2025
- File Size 0.9MB
- # of Slides 2
- File Format PPTX
- Slide Ratio 16:9
- Color
Keywords
- #Content-Based Slides
- #Design-Based Slides
- #Business Strategy
- #Market and Competitor Analysis
- #Graph
- #Future Outlook
- #Column
- #Grouped Column
- #Project Progress
- #16:9
- #dual-axis column chart PowerPoint
- #positive negative data comparison slides
- #business progress report template
- #two-way data visualization
- #management performance PPT
About the Product
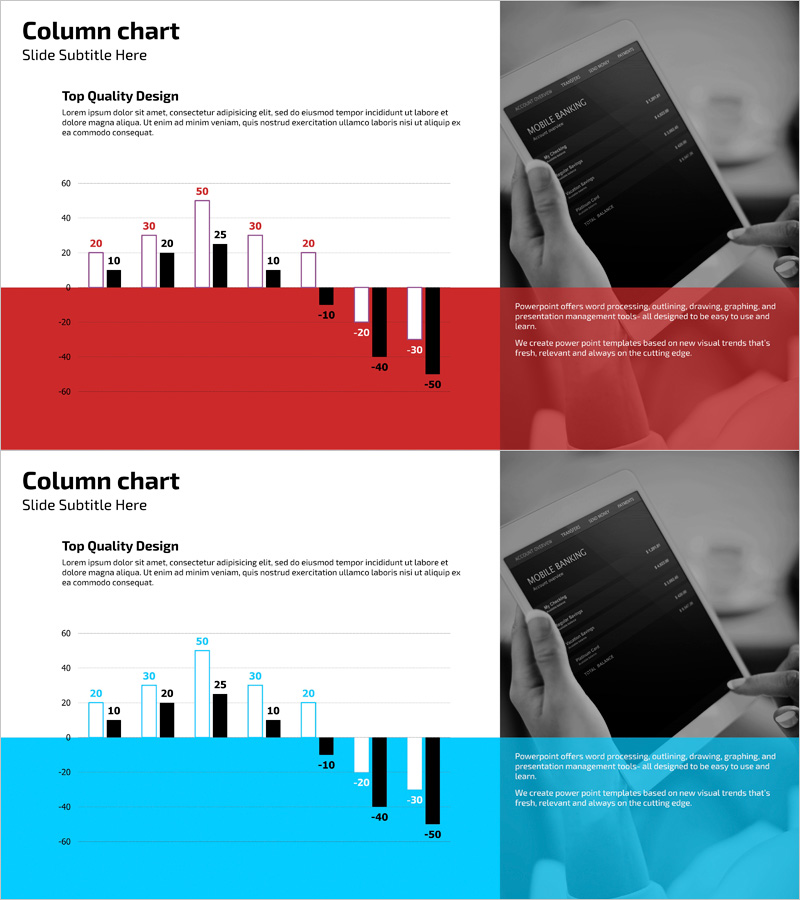
A dual-axis column chart PowerPoint slide designed to visualize IT service business progress and future outlook. The upper section displays positive performance metrics using light gray and black columns showing upward trends, while the lower section presents negative indicators or risk factors in red and black columns showing downward trends. Each data point is clearly labeled with numerical values for immediate presentation use. This 16:9 widescreen 2-slide set is ideal for business performance analysis, market forecasting, and management status reports across various corporate presentations.
Usage Points
-
Main Usage
Visualizes business progress and future outlook by contrasting positive and negative data on upper and lower axes. Enables balanced management analysis by simultaneously displaying positive achievements and risk factors. Designed to provide at-a-glance understanding of IT service industry growth trends and market risks.
-
How to Use
Used in executive briefings, investor presentations, and business performance reports. Upper columns represent positive indicators such as revenue, customer satisfaction, or market share, while lower columns show negative metrics like costs, churn rates, or competitive threats. Directly edit numerical values to reflect actual business data and create comparative analysis.
-
Recommended For
Ideal for IT service company executives, business managers, and marketing teams presenting quarterly or annual performance results. Also effective for investment pitch decks, consulting proposals, and strategic planning meetings. Suitable for any business scenario requiring data-driven decision-making and balanced performance assessment.
-
Slide Structure
Two-slide set with each slide divided into upper positive zone (light gray and black columns for 5-6 items) and lower negative zone (red and black columns for 5-6 items). Symmetrically arranged around a central zero baseline, with numerical labels above each column. Left side contains item names and right side provides text area for contextual explanation.
Related Products
-

Progress and Profit Outlook Graph – Harmony of Green and Orange
#Business Strategy #Graph #Financial Outlook & Expected Impact
-

Energy Saving Future Outlook Vertical Bar Graph
#Market and Competitor Analysis #Financial Plans and Performance #Graph
-

Flowering Period Graph – Future Outlook Analysis
#Market and Competitor Analysis #Graph #Future Outlook
-

Blue Line Wide Template Vertical Bar Chart – Ideal for Business Strategy
#Business Strategy #Marketing Plan and Strategy #Graph
