Technology Business Status and Future Prospects – Visualizing Future Through Data
RJ0400027_7
- Last Update 05/25/2025
- File Size 2MB
- # of Slides 2
- File Format PPTX
- Slide Ratio 16:9
- Color
Keywords
About the Product
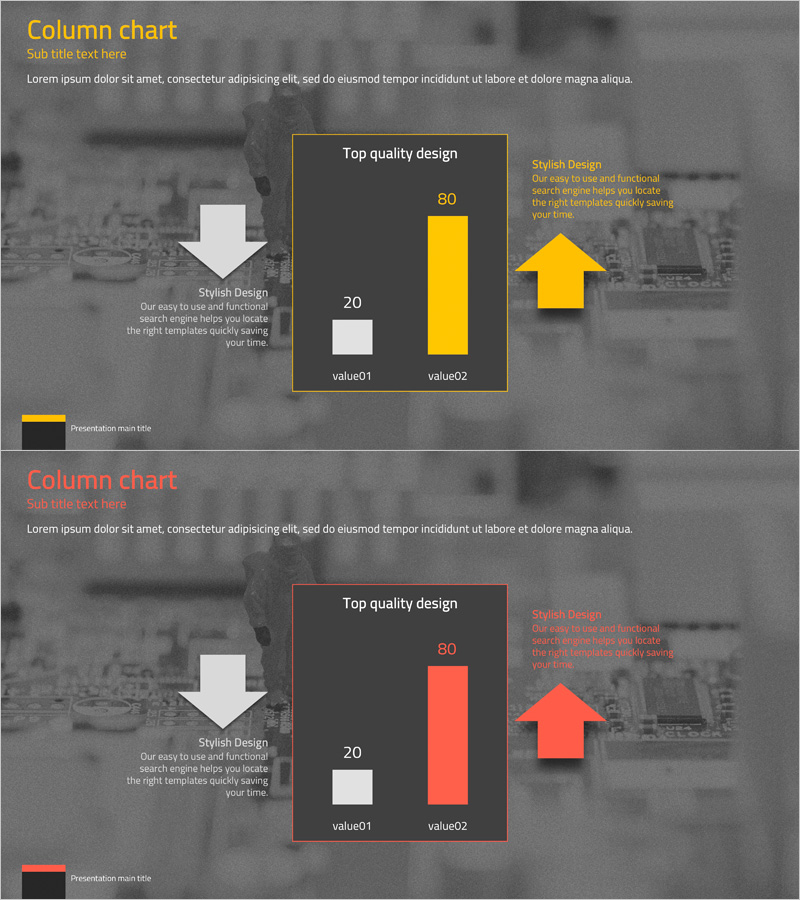
A vertical column chart PowerPoint slide that clearly visualizes technology business status and future prospects through numerical data comparison. Designed to intuitively compare two data values with high contrast between dark background and bright columns. Two color versions—yellow and red—are provided to suit different presentation contexts. The slide structure enables immediate data input and automatic bar height adjustment. Ideal for business analysis presentations, performance reports, market overview slides, and strategic planning documents.
Usage Points
-
Main Usage
Visualizes two key business metrics—current status and future prospects—side by side using vertical columns. Enables clear numerical comparison of business performance, market size, growth rates, or other paired data points to enhance audience comprehension.
-
How to Use
Input actual numerical values into the slide; bar heights automatically adjust proportionally. Yellow version conveys positive, dynamic atmosphere; red version emphasizes critical metrics or alerts. Use in investor presentations, quarterly business reviews, strategic planning sessions, and executive briefings.
-
Recommended For
Ideal for technology company executives, business analysts, marketing teams, and investor presentations. Fits well in business plans, annual reports, market analysis documents, and performance dashboards requiring data-driven insights.
-
Slide Structure
2-slide set with identical layout structure in yellow and red color themes. Each slide contains title area, two vertical columns (value01 and value02), descriptive text zones, and accent design elements for visual emphasis.
Related Products
-

Business Meeting Analysis Bar Graph Slide – Market and Competitive Analysis
#Market and Competitor Analysis #Graph #Future Outlook
-

Travel Market Future Outlook Analysis Chart – Drawing Future Opportunities
#Technical Approach #Market and Competitor Analysis #Graph
-

Future Outlook Analysis Bar Graph – Essential for Market Analysis
#Market and Competitor Analysis #Graph #Future Outlook
-

Outlook Analysis Graph for Market and Competitive Analysis
#Market and Competitor Analysis #Graph #Market Status
