Medical Business Goals History Diagram
RJ0400023_6
- Last Update 05/24/2025
- File Size 4.6MB
- # of Slides 2
- File Format PPTX
- Slide Ratio 16:9
- Color
Keywords
- #Content-Based Slides
- #Design-Based Slides
- #Company Introduction
- #Business Vision and Strategy
- #Diagram
- #History
- #Business Goals
- #Cluster
- #Closed Cluster Diagram
- #16:9
- #closed-loop diagram PowerPoint
- #medical business goals slide
- #history diagram template
- #4-stage circular diagram
- #healthcare growth process PPT
- #diagram PowerPoint slide design
About the Product
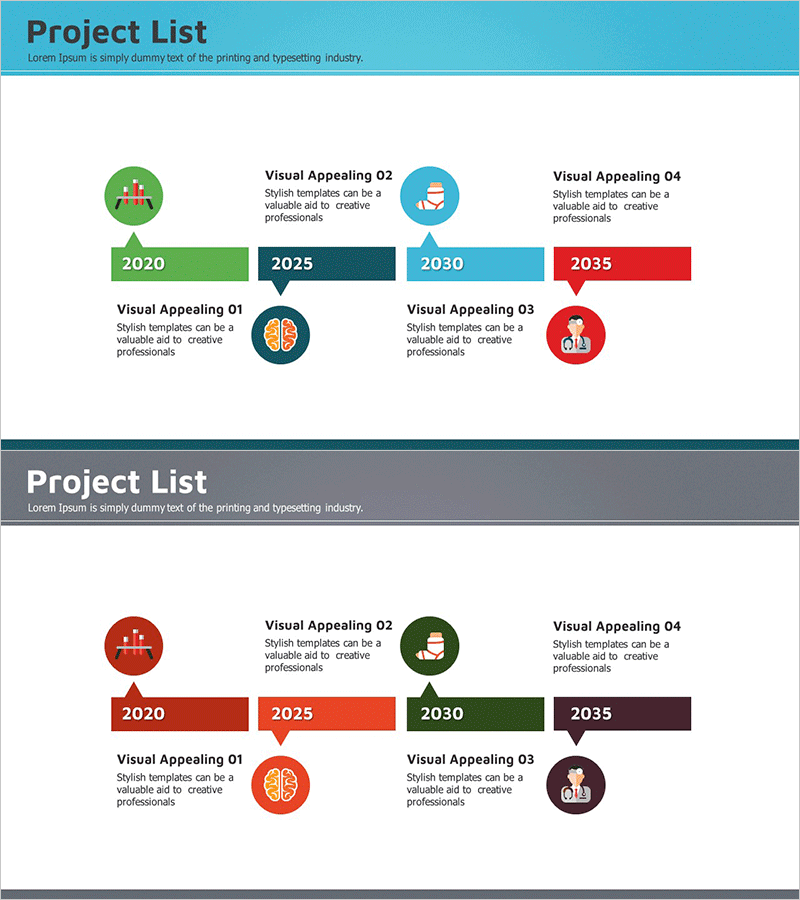
A closed-loop diagram PowerPoint slide designed to visualize medical business objectives and organizational history. Four nodes are connected in a circular flow structure, representing growth stages over time with distinct icons and text areas for each milestone. The design uses a vibrant color palette—green, blue, red, and purple—to differentiate each stage, while central connecting lines emphasize process integration and continuity. This PowerPoint slide template is ready to use in executive presentations, company profiles, and business plan pitches for healthcare institutions, hospitals, and medical enterprises.
Usage Points
-
Main Usage
Designed to communicate healthcare organizations' business objectives and historical milestones in a time-sequenced, stage-by-stage format. The closed-loop circular structure visually represents continuous growth and cyclical improvement processes, making it ideal for demonstrating organizational evolution and strategic progression.
-
How to Use
Insert this diagram into executive presentations, company overview slides, or business plan decks in the 'Company History' or 'Business Objectives Achievement' section. Customize the text and icons in each node to reflect your actual business stages, milestones, and achievements for immediate presentation use.
-
Recommended For
Healthcare executives, hospital marketing teams, medical startups, pharmaceutical companies, medical device manufacturers, health policy officers, and medical consulting firms presenting business reports, investor pitches, or expansion strategies.
-
Slide Structure
Four circular nodes connected by central lines in a closed-loop circular arrangement. Each node features a distinct color (green, blue, red, purple) for visual differentiation and contains icon and text input areas. Directional arrows between nodes indicate flow direction and process continuity, emphasizing timeline progression.
Related Products
-

Molecular Graphics History – Business Vision and Goals
#Company Introduction #Business Vision and Strategy #Diagram
-

Sustainable Environmental Growth Plan – Vision and Technology Strategy
#Business Vision and Strategy #Technical Approach #Diagram
-

Shells and Starfish Diagrams – Visualizing Your Business Strategies
#Business Vision and Strategy #Diagram #Business Vision
-

Review and Flag Illustration – Business Vision and Marketing Strategy
#Business Vision and Strategy #Marketing Plan and Strategy #Diagram
