Medical Business Sector Connection Diagram – Cluster Infographic
RJ0400023_16
- Last Update 05/24/2025
- File Size 4.6MB
- # of Slides 2
- File Format PPTX
- Slide Ratio 16:9
- Color
Keywords
About the Product
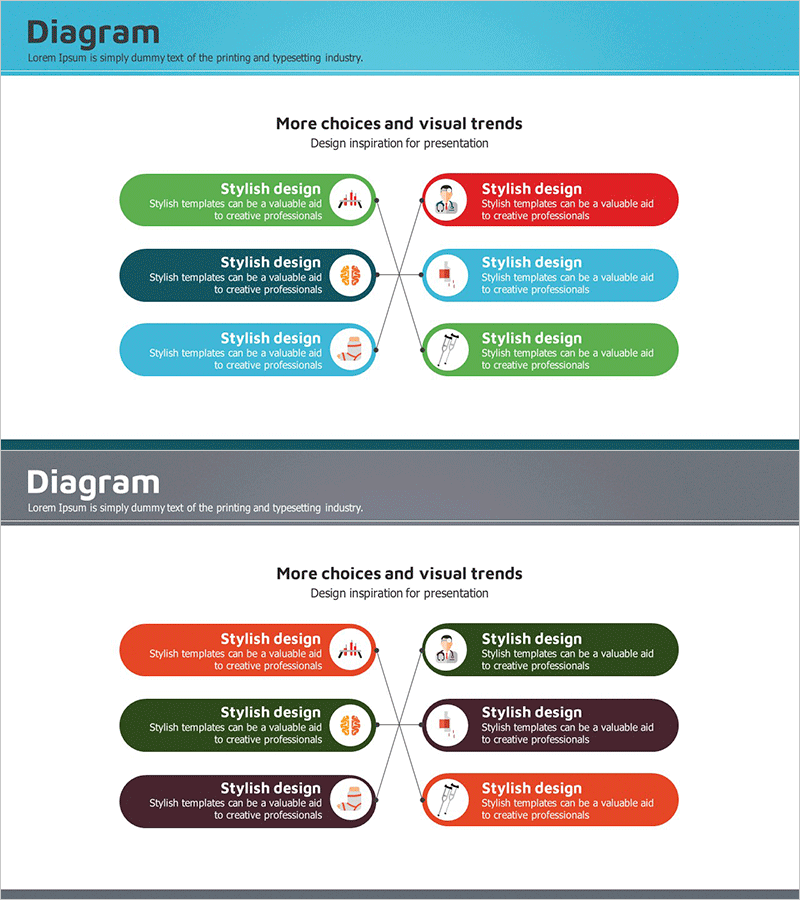
A radial connection diagram PowerPoint slide that branches from a central hub to six topics with multicolor speech bubbles and circular icons. The design features green, red, blue, and orange callout boxes connected by bidirectional arrows, clearly representing mutual relationships and interactions. This slide template is optimized for visualizing complex relationships in medical sector analysis, business field mapping, organizational role integration, and process interdependencies. The 2-slide set allows flexible content arrangement with fully editable colors and text for professional presentations.
Usage Points
-
Main Usage
Visualizes complex organizational interactions, business sector connections, process interdependencies, and role distribution systems through a central hub structure. Effectively represents business ecosystems, inter-departmental collaboration frameworks, and supply chain networks across healthcare, pharmaceutical, financial, and manufacturing industries.
-
How to Use
Enter the core concept in the central hub, then fill in each of the six speech bubbles with item names and descriptions. The bidirectional arrows represent mutual interactions, allowing you to adjust colors and icons to match presentation flow and emphasize key relationships. Use both slides for comparison, contrast, or temporal progression.
-
Recommended For
Recommended for executives, business planners, marketing managers, healthcare administrators, consultants, and educators presenting organizational structures, business strategies, and collaboration frameworks. Particularly useful for stakeholder analysis, ecosystem mapping, departmental role definition, and project collaboration structure explanations.
-
Slide Structure
2-slide set with central circular hub branching into 6 directions via bidirectional arrows and multicolor speech bubbles (green, red, blue, orange, black, purple). Each callout box contains an icon and text input area for simultaneous data visualization and explanation.
Related Products
-

Diffusion Diagram Without Center – Effective Business Introduction
#Company Introduction #Business Introduction #Diagram
-

Astronomy Research Core Areas Diagram – Vision and Strategy of the Business
#Company Introduction #Business Vision and Strategy #Diagram
-

Visualization of Technology Business Fields and Areas – The Harmony of Yellow and Red
#Company Introduction #Business Introduction #Diagram
-

Planetary Graphic Diagram – Visualized Business Domains
#Company Introduction #Business Introduction #Diagram
