Science Experiment Core Competency Diagram
RJ0400019_18
- Last Update 05/22/2025
- File Size 1MB
- # of Slides 2
- File Format PPTX
- Slide Ratio 16:9
- Color
Keywords
- #Content-Based Slides
- #Design-Based Slides
- #Business Vision and Strategy
- #Diagram
- #Core Competencies
- #Cluster
- #Closed Cluster Diagram
- #16:9
- #closed-form diamond diagram PowerPoint
- #4-node symmetric diagram slide
- #core competency diagram template
- #business model diagram PPT
- #how to create diamond diagram in PowerPoint
About the Product
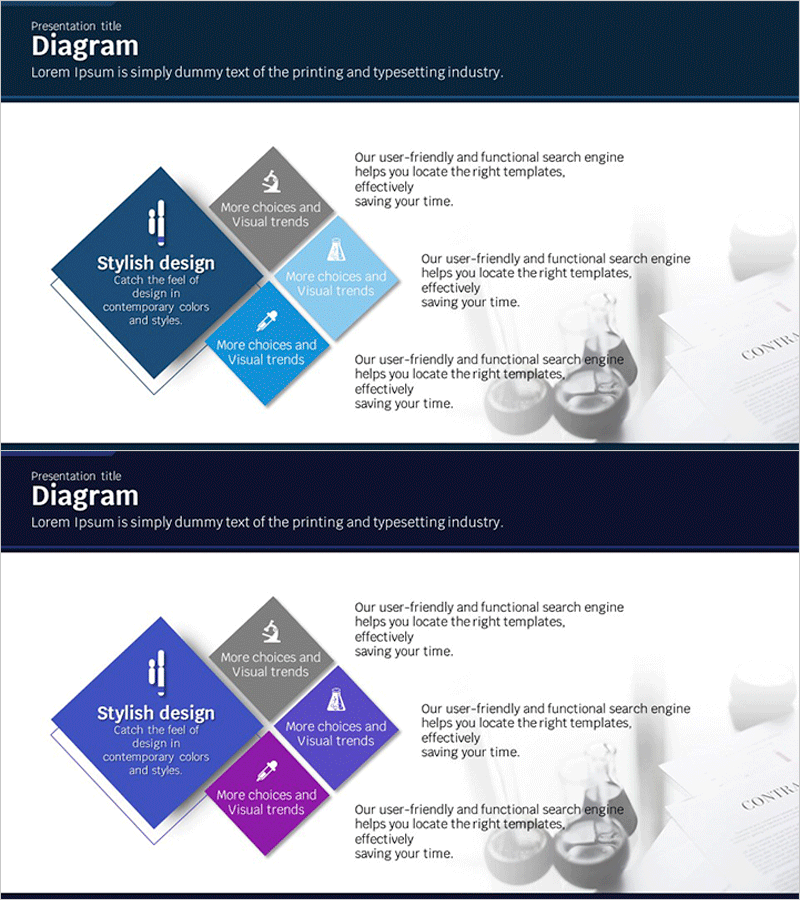
A closed-form diamond diagram PowerPoint slide featuring four nodes arranged in a symmetric diamond pattern around a central concept. This structure effectively visualizes four interconnected elements such as core competencies, strategic pillars, business model components, or key success factors. The design uses a gradient color palette of dark blue, light blue, gray, and purple tones with white typography to convey professionalism and clarity. Each node includes dedicated areas for icons and descriptive text, allowing flexible customization for various presentation contexts. Two slide variations with different color combinations enable consistent visual branding throughout your presentation. Optimized for 16:9 widescreen format in PPTX, ensuring compatibility with modern presentation software.
Usage Points
-
Main Usage
Effectively communicate four interconnected elements such as organizational core competencies, competitive advantages, business model pillars, or strategic initiatives. The symmetric diamond structure around a central concept creates visual balance and emphasizes the interdependence of all four components.
-
How to Use
Insert titles, descriptions, and icons into each diamond node to define your four key elements. Select the appropriate color variation (dark blue or purple tone) to match your presentation theme and maintain consistent branding. Use as a conceptual framework slide in business presentations, strategy meetings, and educational seminars.
-
Recommended For
Ideal for executives, strategy planners, marketing professionals, educators, and consultants presenting organizational strategy, core competencies, or business models. Suitable for business plans, strategic reports, proposals, and training materials where emphasizing key concepts is essential.
-
Slide Structure
Two-slide set, each featuring a central diamond node (core concept) surrounded by four outer diamond nodes (supporting elements) in a closed symmetric arrangement. Slide 1 uses dark blue, light blue, and gray gradients; Slide 2 features purple and light blue tones. All nodes contain editable text boxes and icon placeholders for customization.
Related Products
-

Visual Diagram for Global Export Business Vision
#Business Vision and Strategy #Diagram #Business Vision
-

Competitive Advantage Summary Slide – Business Vision and Strategy
#Business Vision and Strategy #Market and Competitor Analysis #Diagram
-

Data Analysis Core Competencies Slide – Visualizing Business Strategy
#Business Vision and Strategy #Diagram #Business Vision
-

Sailing Travel Business Differentiation Strategy Closed Diagram
#Product/Service Introduction #Business Vision and Strategy #Diagram
