Step-by-step Plans and Key Messages – Business Strategy Diagram
RJ0600065_8
- Last Update 07/07/2025
- File Size 0.1MB
- # of Slides 2
- File Format PPTX
- Slide Ratio 16:9
- Color
Keywords
- #Content-Based Slides
- #Design-Based Slides
- #Business Vision and Strategy
- #Business Strategy
- #Diagram
- #Business Goals
- #Step-by-Step Schedule Plan
- #Structure
- #Cluster
- #Pyramid Chart
- #Chain Diagram
- #16:9
- #4-step diagram PowerPoint
- #step-by-step plan slide template
- #connected flow diagram
- #business strategy process diagram
- #how to create process diagram in PowerPoint
About the Product
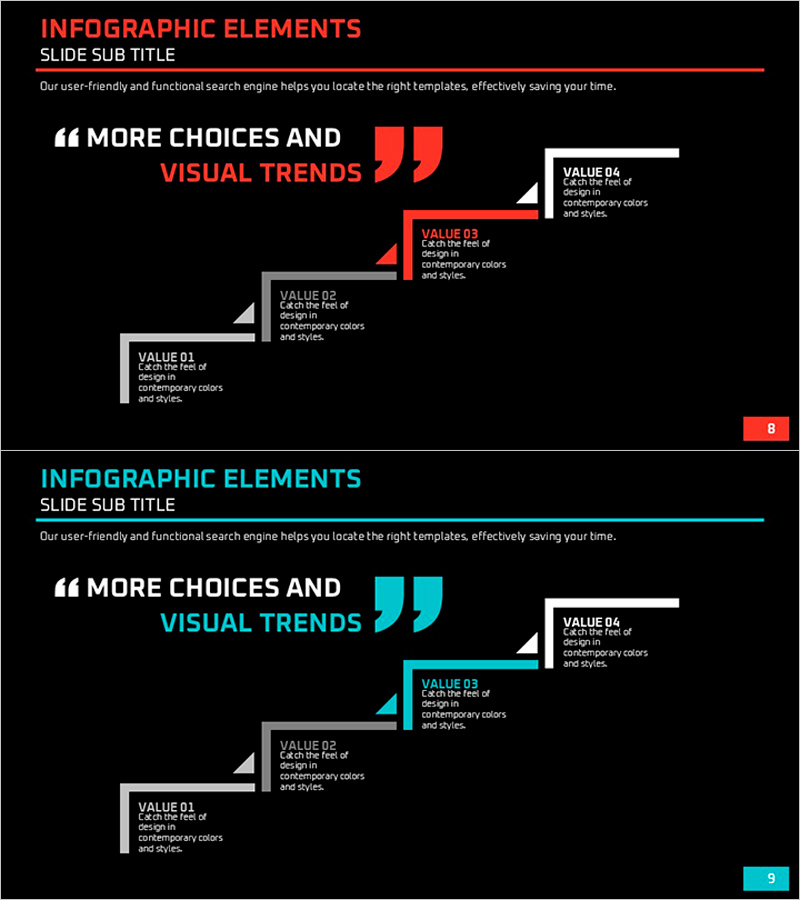
A 4-step connected flow diagram PowerPoint slide that visualizes business strategy and key messages in sequential stages. Set against a black background with red and blue two-tone accent colors in a minimal layout, each step features VALUE 01–04 text boxes for clear organization of plan items and descriptions. The arrow-connected rectangular shapes intuitively convey process flow and cause-effect relationships, making it ideal for business presentations, strategic reports, and roadmap presentations. Instantly applicable for step-by-step implementation plans, core value propositions, and milestone tracking. Provided as a 16:9 widescreen PPTX file with 2 slides.
Usage Points
-
Main Usage
Visualizes step-by-step implementation plans for business strategy, marketing initiatives, and project roadmaps. Each stage displays a core value (VALUE) that communicates the logical flow and cause-effect relationships of your strategy to the audience in an intuitive manner.
-
How to Use
Enter plan names, objectives, and implementation details in each VALUE text box. The arrow direction represents time progression or process sequence, and colors can be customized to distinguish priorities or categories. Insert into presentation slides, reports, and proposals to transform complex plans into clear, structured visuals.
-
Recommended For
Executives, planning teams, marketing departments, and project managers presenting business plans, strategic reports, investment pitches, and proposals. Suitable for any project requiring phased execution, such as new business launches, organizational restructuring, marketing campaigns, and system implementations.
-
Slide Structure
Black background with title area (INFOGRAPHIC ELEMENTS / SLIDE SUB TITLE) at the top and content area below. Four rectangular shapes connected by arrows flow from left to right, each containing VALUE 01–04 labels and text input fields. Red and blue two-tone accent colors alternate across stages for clear visual distinction.
Related Products
-

Step-by-step Plan for Cosmetics Production – Business Vision and Goals
#Business Vision and Strategy #Business Strategy #Diagram
-

Business Objectives Layer Diagram – Visual Representation of Business and Marketing Strategies
#Business Vision and Strategy #Marketing Plan and Strategy #Diagram
-

Origami Step Diagram – Business Goals and Strategies
#Business Vision and Strategy #Business Strategy #Diagram
-

Diet Pyramid Strategy Presentation Slide
#Business Vision and Strategy #Marketing Plan and Strategy #Diagram
