Visualizing Service Features with Automotive Instrument Panel and Text Box
RJ0800027_7
- Last Update 08/07/2025
- File Size 1.3MB
- # of Slides 2
- File Format PPTX
- Slide Ratio 16:9
- Color
Keywords
About the Product
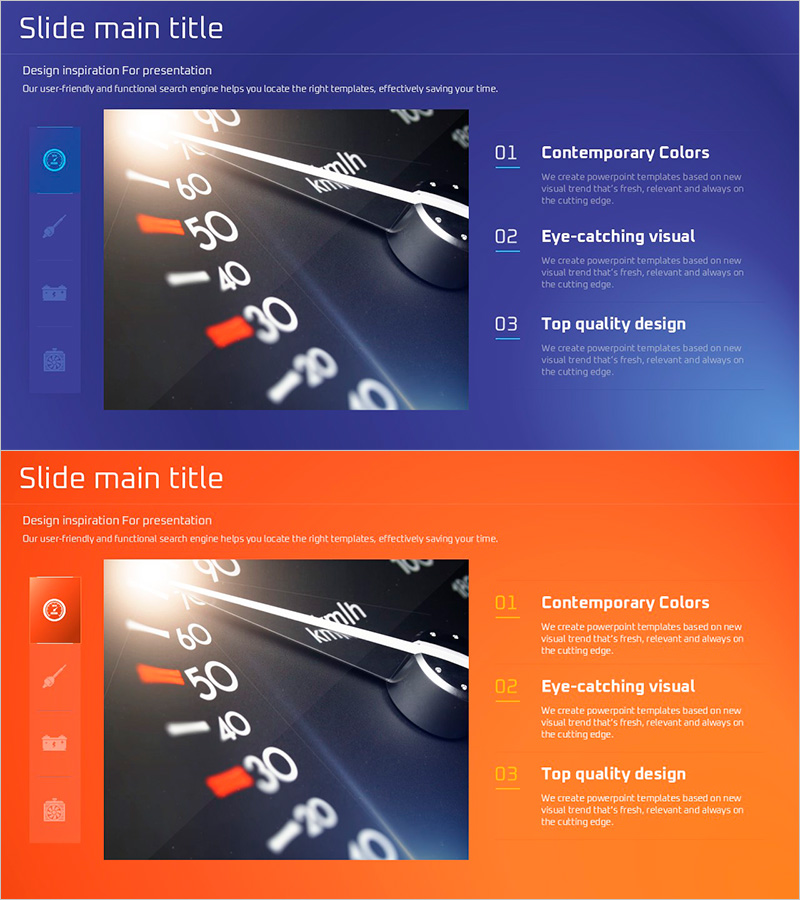
A PowerPoint slide set visualizing service characteristics using an automotive instrument panel design. The 2-slide composition features a dark blue background with orange accent colors, with a clear separation between left-side icon navigation and right-side text box areas. Each slide provides a numbered list structure for three key items, with a central image area to emphasize core service value. Effectively conveys both technical credibility and innovation in business management and service introduction presentations. Available in 16:9 widescreen PPTX format, ready for immediate editing and customization.
Usage Points
-
Main Usage
Visualizes core service characteristics and differentiation factors through an instrument panel metaphor, simultaneously conveying technical credibility and innovation. In business management presentations, clearly explains service components and effectively appeals to investors and partners regarding the company's technical capabilities.
-
How to Use
Place category icons for each item in the left icon area, and input descriptions and figures for corresponding items in the right text boxes. Insert service-related photos or product images in the central image area to enhance visual impact. The numbered structure enables sequential information delivery and logical flow.
-
Recommended For
Ideal for IT and technology company service introduction presentations, startup business plan pitches, IR materials emphasizing product innovation, and executive reports for technology-based companies. Particularly effective when simultaneously conveying technical credibility and a modern corporate image.
-
Slide Structure
2-slide composition with each slide featuring left-side icon navigation (4 icons), central image area, and right-side 3-item numbered text boxes. Dark blue background with orange accent lines and numbered indicators clearly express information hierarchy and visual organization.
Related Products
-

Red Orange Table Chart – Optimized Diagram for Business Management
#Product/Service Introduction #Business Management #Diagram
-

Detailed Strategy Action Plan Slide Template
#Product/Service Introduction #Business Management #Diagram
-

Service Characteristics Horizontal Bar Graph – Product/Service Introduction
#Product/Service Introduction #Business Management #Text Box
-

Express Unique Charm with Hamburger and Icons
#Product/Service Introduction #Product/Service Introduction #Features
