Cluster Connection History Diagram – Visualizing Company Growth
RJ0400011_4
- Last Update 05/20/2025
- File Size 0.4MB
- # of Slides 2
- File Format PPTX
- Slide Ratio 16:9
- Color
Keywords
- #Content-Based Slides
- #Design-Based Slides
- #Company Introduction
- #Diagram
- #History
- #Cluster
- #Chain Diagram
- #16:9
- #cluster diagram PowerPoint
- #timeline diagram template
- #company growth visualization slide
- #4-node cluster slide
- #year-by-year development diagram
- #how to create timeline diagram in PowerPoint
About the Product
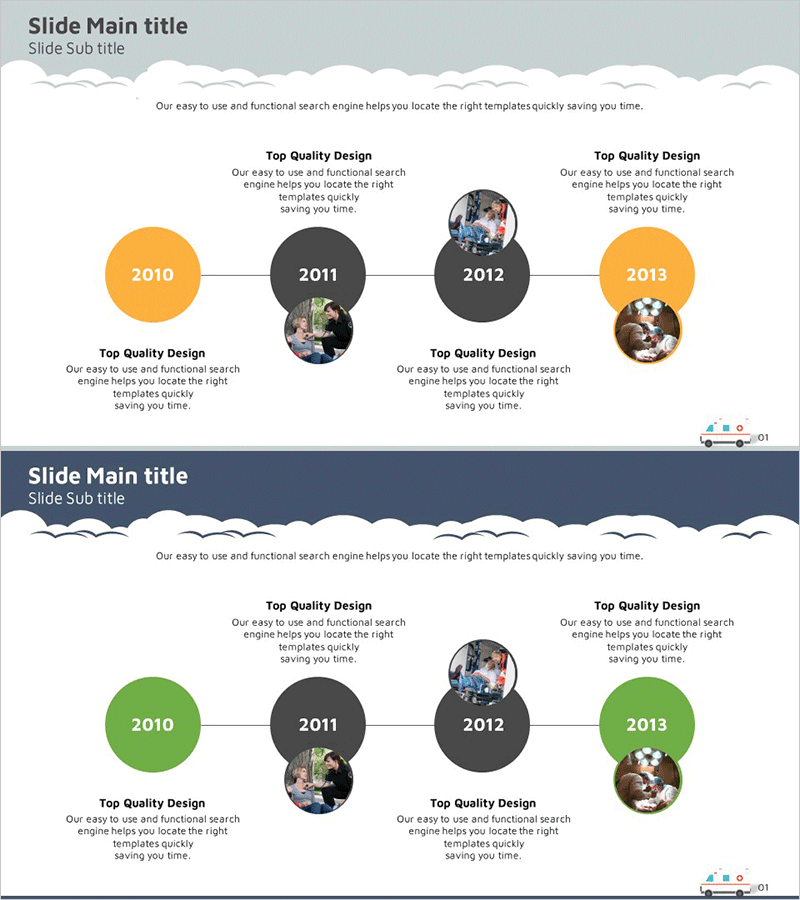
A cluster connection timeline diagram PowerPoint slide that visualizes company growth through four interconnected nodes. This 2-slide presentation template uses contrasting orange and gray color schemes to represent year-by-year development stages. Four circular nodes (2010, 2011, 2012, 2013) are arranged symmetrically around a central axis and connected by lines, with dedicated photo insertion areas and text description spaces in each node. Ideal for company profile presentations, business performance reports, and organizational history slides that require immediate deployment.
Usage Points
-
Main Usage
Represents company year-by-year development, business growth stages, and organizational expansion history through four interconnected cluster nodes. The symmetrical center-axis arrangement emphasizes equal importance of each stage while connection lines clarify cause-and-effect relationships in chronological progression.
-
How to Use
Apply to 'Company History' sections in corporate profile presentations, 'Growth Timeline' pages in business performance reports, and 'Business Development History' slides in investor pitch decks. Insert key event images into each node's photo area and add year labels and major achievements in text boxes to complete the slide.
-
Recommended For
Company executives, marketing managers, business planning teams, and PR professionals presenting company history and growth trajectory. Particularly effective for new employee orientation, investor briefings, and customer trust-building presentations where organizational stability and growth potential need visual demonstration.
-
Slide Structure
2-slide layout with cloud-shaped decorative header element. Central cluster structure featuring four circular nodes (2010, 2011, 2012, 2013) connected by horizontal lines. Alternating orange and gray node colors. Each node includes upper and lower text box areas plus circular photo insertion zones. Balanced left-right and top-bottom arrangement around central axis.
Related Products
-

History Overlay Diagram – Company Introduction Slide
#Company Introduction #Diagram #History
-

History Flag Shape Diagram - Company Growth and Vision
#Company Introduction #Diagram #History
-

Business History Connection Diagram – Company Growth Story
#Company Introduction #Diagram #History
-

Fountain Pen History Diagram – Emphasizing Corporate Identity
#Company Introduction #Product/Service Introduction #Diagram
