Vision and Mission Inclusion Diagram – Visualizing Customer and Partner Relations
RJ0400011_20
- Last Update 05/20/2025
- File Size 0.3MB
- # of Slides 2
- File Format PPTX
- Slide Ratio 16:9
- Color
Keywords
About the Product
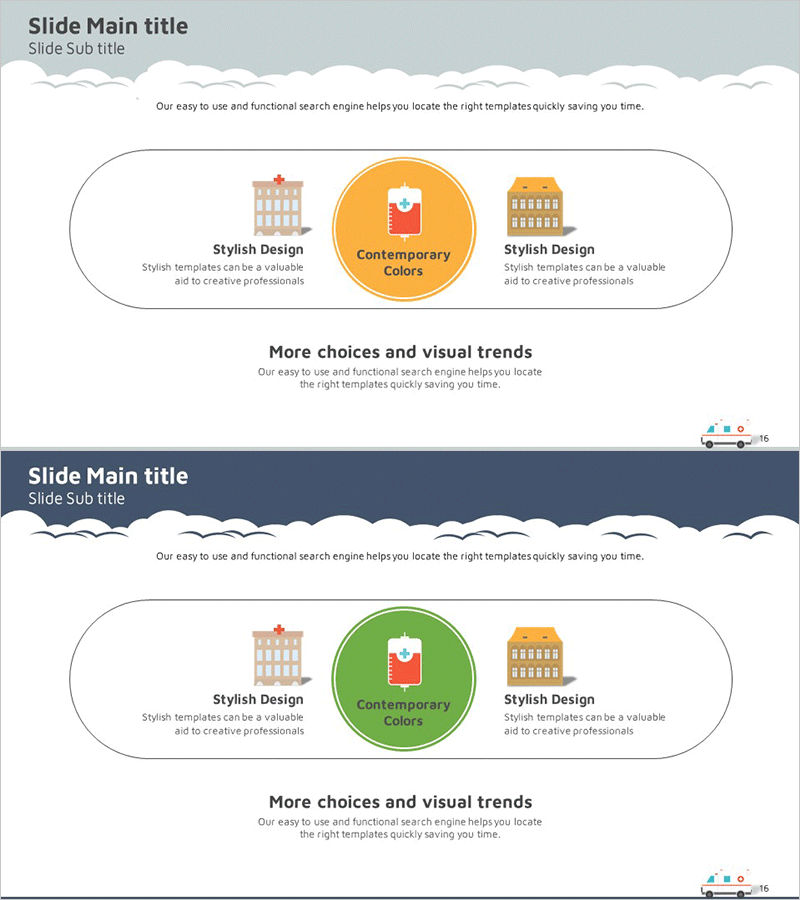
A radial inclusion diagram PowerPoint slide that visualizes the relationship between vision and mission at the center, with customers and partner organizations positioned symmetrically on both sides. The central circular node anchors the core message, while building icons and text areas are arranged in a balanced cluster structure to clearly express organizational connectivity. The design uses a gray background with orange and green accent circles to establish visual hierarchy, presented in a 2-slide 16:9 format ready for immediate use in presentations and company profiles. The editable PPTX format allows full customization of colors, text, and icons to match your organization's branding.
Usage Points
-
Main Usage
Designed to present organizational vision, mission, and stakeholder relationships (customers and partners) at a glance. The symmetrical arrangement around a central circular node creates a balanced relationship structure, making it ideal for company introductions, strategic presentations, and partner ecosystem explanations.
-
How to Use
Enter your core message (vision, mission, or strategy) in the central orange or green circular node. Fill in customer, partner, or collaborator information in the text areas below the building icons on both sides. Colors and icons can be customized to match your organization's identity. The 2-slide format works well as an overview followed by detailed content slides.
-
Recommended For
Perfect for executives, business development teams, and marketing professionals presenting organizational structure, partnership models, and stakeholder maps. Particularly effective in company profiles, business plans, proposals, and investor pitch decks where visual communication of organizational ecosystem and partnerships is essential.
-
Slide Structure
2-slide composition. Each slide features one central circular node (orange or green) with two building icons positioned symmetrically on either side and three text input areas. White border lines distinguish the nodes against the gray background. The 16:9 aspect ratio is optimized for widescreen display and modern presentation formats.
Related Products
-

Construction Business Partner Collaboration Diagram - Connecting Clients and Partners
#Company Introduction #Product/Service Introduction #Diagram
-

A New Approach to Addressing the Problem – Business Vision and Innovation
#Business Introduction #Business Vision and Strategy #Diagram
-

Airplane Composition Diagram – A New Benchmark for Data Analysis
#Product/Service Introduction #Diagram #Composition
-

Market Analysis Presentation Template Visualized with Newspaper Diagram
#Market and Competitor Analysis #Marketing Plan and Strategy #Diagram
