Stable Business Goal Connection Diagram
RJ0400016_9
- Last Update 05/21/2025
- File Size 0.3MB
- # of Slides 2
- File Format PPTX
- Slide Ratio 16:9
- Color
Keywords
- #Content-Based Slides
- #Design-Based Slides
- #Company Introduction
- #Business Vision and Strategy
- #Diagram
- #Business Areas
- #Business Goals
- #Cluster
- #Chain Diagram
- #16:9
- #connection diagram PowerPoint
- #hexagon diagram slide template
- #business goal framework
- #organizational structure diagram
- #how to create connection diagram in PowerPoint
About the Product
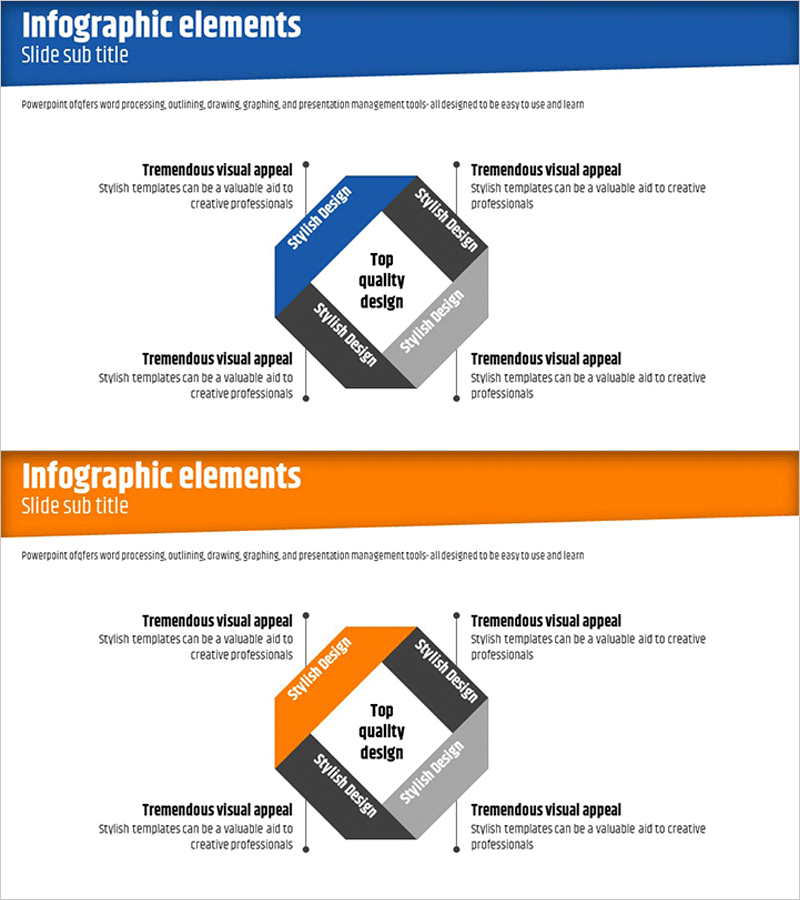
A hexagon connection diagram PowerPoint slide that visualizes relationships between business objectives and strategic goals. The design features a central hexagon labeled 'Top quality design' surrounded by four symmetrically positioned hexagon nodes, each distinguished by diagonal stripes in black, blue, and gray tones. This 16:9 widescreen 2-slide set effectively illustrates business strategy frameworks, organizational goal hierarchies, and project interdependencies. Each node includes editable text areas for entering company objectives, departmental targets, or performance metrics, enabling immediate customization and presentation-ready output.
Usage Points
-
Main Usage
Designed to clearly display the hierarchical relationships between core organizational objectives and supporting goals. Ideal for business plans, strategic reports, and organizational restructuring presentations where goal frameworks, interdepartmental collaboration structures, and project dependencies need to be communicated effectively.
-
How to Use
Enter the primary objective in the central hexagon and supporting goals, strategies, or KPIs in the four surrounding nodes. Edit the colored stripe text to specify each area's role, and adjust node quantities or text sizing as needed to match your presentation requirements and audience context.
-
Recommended For
Executives, strategy managers, project managers, and organizational development professionals presenting goal hierarchies, organizational structures, and cross-functional relationships. Particularly effective for multi-department collaboration initiatives, new business launches, and organizational transformation announcements.
-
Slide Structure
One central hexagon (core objective) plus four surrounding hexagon nodes arranged in symmetric top-bottom-left-right positions. Each node features three-color diagonal stripes (black, blue, gray) with four editable text input areas. Two-slide set includes blue-tone and orange-tone color variations.
Related Products
-

AI Service Main Business Areas – Vision of Innovation and Growth
#Company Introduction #Business Vision and Strategy #Diagram
-

Business Area Linkage Overlay Diagram
#Company Introduction #Business Vision and Strategy #Diagram
-

Business Strategy Presentation Using Triangle Diagram
#Company Introduction #Business Vision and Strategy #Diagram
-

Collaborative Business Diagram – Business Strategy and Goals
#Company Introduction #Business Vision and Strategy #Diagram
