Modern Design Step-by-Step PowerPoint Slide
RJ0400007_6
- Last Update 05/18/2025
- File Size 0.5MB
- # of Slides 2
- File Format PPTX
- Slide Ratio 16:9
- Color
Keywords
About the Product
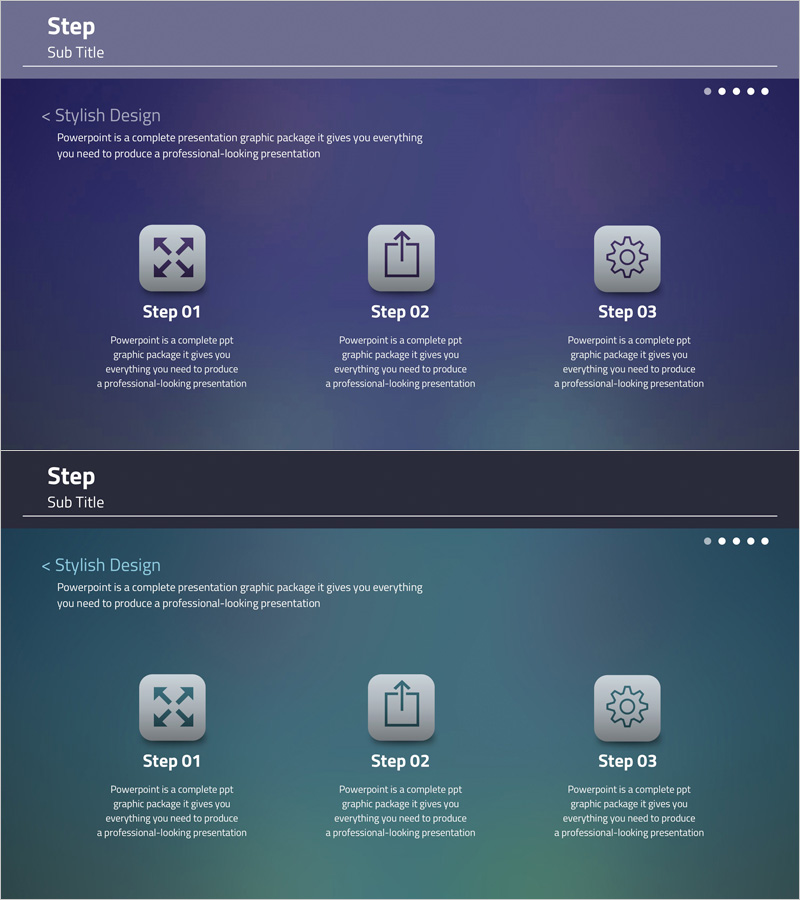
A professional PowerPoint slide designed to clearly present technical processes and sequential procedures. Featuring a navy background with white typography and gray icons across 2 slides, each stage includes dedicated areas for title, description, and icon elements. Optimized for technology presentations, system implementation processes, and development roadmap explanations. Available in 16:9 widescreen PPTX format, fully editable and ready for immediate use in procedure explanation sections of presentations.
Usage Points
-
Main Usage
Ideal for technology presentations explaining system implementation processes, service development stages, and research workflows. The combination of icons and text enables clear communication of each stage's objectives and execution details to stakeholders.
-
How to Use
Input process titles and descriptions into each stage section, and customize icons as needed. Use in technology briefings, system implementation presentations, R&D progress reports, and technical documentation to explain sequential procedures effectively.
-
Recommended For
Technology teams, development departments, system engineers, and R&D professionals presenting technical progress and implementation processes. Suitable for investor pitches, partner meetings, and internal reports requiring credible technical information delivery.
-
Slide Structure
2-slide set with 3 stage sections per slide. Each section features a 3-layer structure: icon area (top), stage title (middle), and descriptive text (bottom). Navy background and gray icons create unified visual hierarchy throughout.
Related Products
-

Ice Hockey Overlap Diagram – Interconnectedness and Introduction
#Product/Service Introduction #Business Introduction #Operational Plan
-

Football Strategy Slide – Business Introduction and Vision
#Business Introduction #Business Vision and Strategy #Diagram
-

Status of Parts Production and Development – Donut Chart Infographic
#Product/Service Introduction #Business Introduction #Graph
-

Athlete Competency Slides – Dynamic Data Visualization
#Business Introduction #Market and Competitor Analysis #Graph
