Cognitive Science Diffusion Diagram – Business Introduction and Technology Status
RJ0500044_12
- Last Update 06/19/2025
- File Size 0.2MB
- # of Slides 2
- File Format PPTX
- Slide Ratio 16:9
- Color
Keywords
- #Content-Based Slides
- #Design-Based Slides
- #Business Introduction
- #Diagram
- #Business Overview
- #Technological Status
- #Spread
- #Radial Diagram
- #16:9
- #radial diagram PowerPoint
- #diffusion diagram slide template
- #5-point node diagram
- #technology status presentation
- #how to create radial diagram in PowerPoint
About the Product
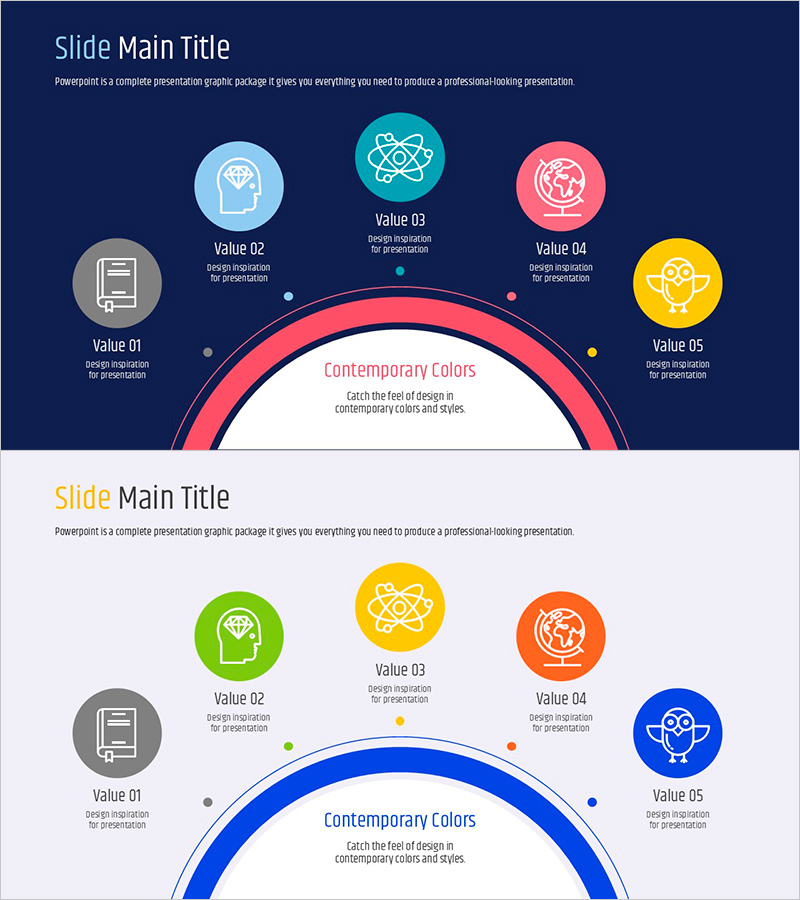
A radial diffusion diagram PowerPoint slide with five nodes extending outward from a central concept. Set against a dark blue background, the design features circular icons in turquoise, pink, yellow, green, and coral colors, visualizing how a core idea branches into five peripheral elements or perspectives. Ideal for presenting cognitive science concepts, technology innovations, business domains, or strategic initiatives. The 2-slide set includes both dark blue and light background versions, with fully editable text and icons for quick customization.
Usage Points
-
Main Usage
Illustrates how a central concept or theme branches into five surrounding elements, perspectives, or domains. Effective for explaining technology innovations, business strategies, organizational roles, core competencies, or market analysis in a radial structure.
-
How to Use
Enter your core concept (e.g., Technology, Business, Innovation) in the central circle. Add five key elements or perspectives in the surrounding icon nodes (e.g., Technology Areas, Market Status, Competitive Advantage, Roadmap, Vision). Customize node text and icon colors as needed.
-
Recommended For
Recommended for technology company business introductions, startup pitch decks, product innovation strategy presentations, organizational structure explanations, and value proposition slides. Suitable for executive, investor, and partner presentations.
-
Slide Structure
2-slide set. Slide 1: Dark blue background with central white circle and five directional colored icon nodes (turquoise, pink, yellow, green, coral) with text input areas below each node. Slide 2: Light background version with identical structure. 16:9 aspect ratio, PPTX format.
Related Products
-

Football Strategy Slide – Business Introduction and Vision
#Business Introduction #Business Vision and Strategy #Diagram
-

Technology Comparison Analysis Connection Diagram
#Business Introduction #Technical Approach #Diagram
-

A Key Battle Strategy Slide – Leading to Victory
#Business Introduction #Technical Approach #Diagram
-

Halloween Pumpkin Diagram - Product and Service Introduction
#Product/Service Introduction #Business Introduction #Diagram
