Cosmetic Ingredient Check List PowerPoint Slide
RJ0400002_15
- Last Update 05/17/2025
- File Size 2.1MB
- # of Slides 2
- File Format PPTX
- Slide Ratio 16:9
- Color
Keywords
About the Product
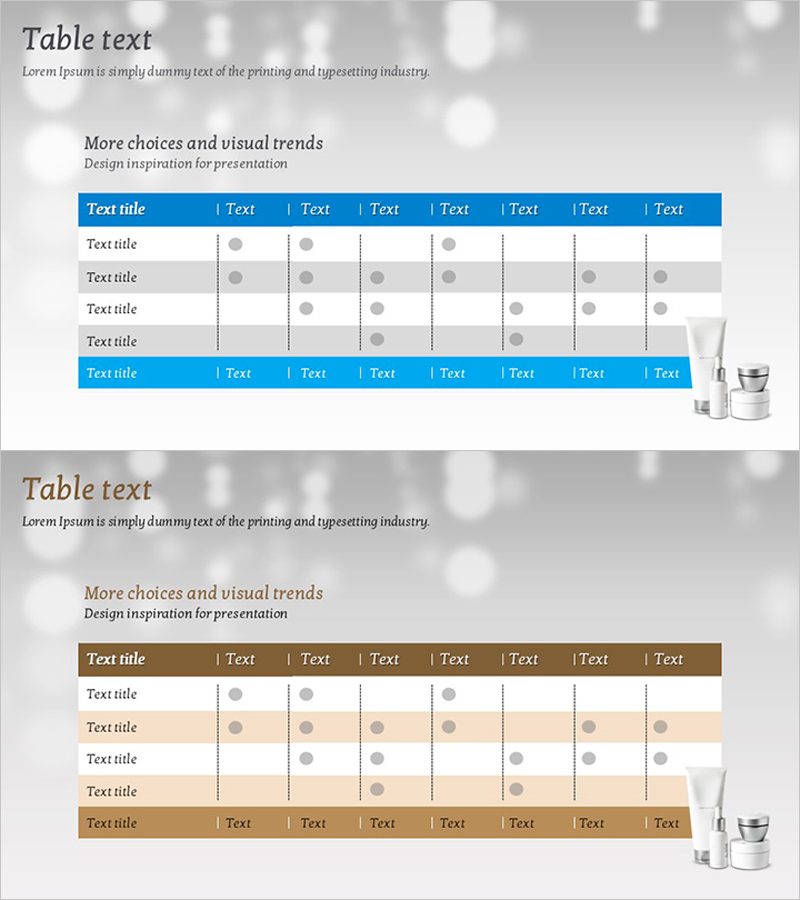
A table-based diagram PowerPoint slide designed for cosmetic ingredient verification and comparative analysis. Features a 5-item by 8-column check matrix structure with circular icons visualizing ingredient inclusion status. The blue header and gray background create clear information hierarchy, making it ideal for cosmetic industry presentations, product introduction decks, and ingredient comparison materials. The 16:9 widescreen format with 2-slide composition allows flexible editing for various presentation scenarios.
Usage Points
-
Main Usage
Enables at-a-glance comparison and verification of cosmetic ingredient inclusion across multiple products. The matrix structure cross-references 5 products or ingredient groups with 8 inspection criteria, using circular icons to clearly indicate presence or absence. Optimized for cosmetic industry presentations including ingredient safety verification, competitive product analysis, and regulatory compliance documentation.
-
How to Use
Replace header text with actual inspection criteria and left-column text with product names. Modify circular icon colors at each intersection point or add checkmarks to input data. Adjust background and header colors to match corporate brand guidelines. All text fields and icons are fully editable within PowerPoint.
-
Recommended For
Recommended for cosmetic and beauty industry marketing teams, product development departments, and quality assurance teams presenting ingredient comparisons. Effective for product introduction decks, technical seminars, regulatory compliance reports, and competitive analysis materials requiring systematic multi-item comparison.
-
Slide Structure
2-slide composition. Slide 1: Blue header with 8 text columns + 5-row data area with alternating gray and white backgrounds + product image area on right. Circular icons (gray) placed in each cell as check points. Slide 2: Identical layout with alternative color scheme (brown header, beige background) for diverse presentation contexts.
Related Products
-

Running Silhouette Step Diagram – Stepwise Action Plan
#Business Strategy #Business Management #Diagram
-

PowerPoint Template for Service Operation Strategy Presentation
#Business Management #Operational Plan #Technical Approach
-

3D Hexahedron Diagram – Visual Business Introduction
#Company Introduction #Business Introduction #Diagram
-

Retirement Planning Element Diagram – Foundations of Financial Planning
#Product/Service Introduction #Diagram #Product/Service Introduction
