Galaxy Theme Brain Structure Explanation Connection Diagram – Innovation and Insight
RJ0400001_15
- Last Update 05/17/2025
- File Size 13.9MB
- # of Slides 2
- File Format PPTX
- Slide Ratio 16:9
- Color
Keywords
About the Product
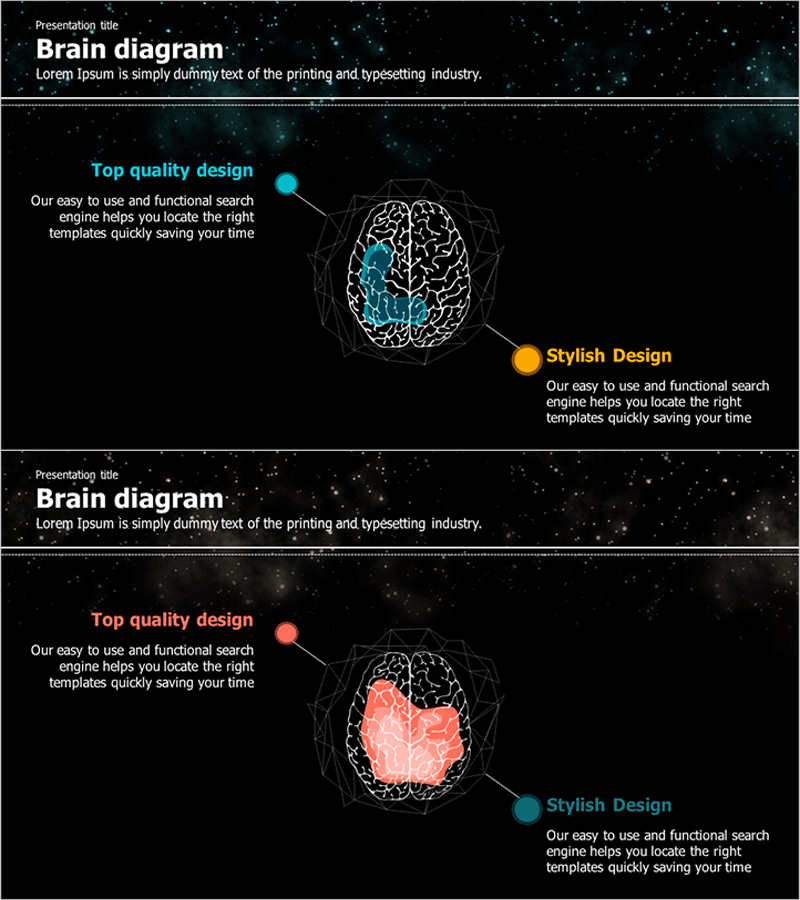
A 2-slide PowerPoint presentation featuring brain silhouette with network connection lines on a dark galaxy-themed background. The design emphasizes left and right brain hemispheres with cyan and orange accent points highlighting key neural regions. This slide deck effectively visualizes neural networks, information flow, and interconnected systems for technology innovation, artificial intelligence, neuroscience, and organizational network presentations. The starfield background creates a forward-thinking atmosphere while maintaining balanced text and diagram placement for clear message delivery.
Usage Points
-
Main Usage
Visually explains brain neural network structures, information processing flows, and interconnected relationships between organizational units. Effectively communicates complex systems and concepts in technology innovation, artificial intelligence, neuroscience, and digital transformation presentations.
-
How to Use
Use as a key slide in technology presentations, research seminars, and innovation strategy discussions to emphasize neural network architecture. Input main concepts in the left text area and visualize connection relationships through the right-side diagram. Each slide can be used independently or sequentially for step-by-step explanations.
-
Recommended For
Technology executives, researchers, innovation managers, IT strategists, neuroscience instructors, and organizational development specialists explaining complex systems. Ideal for startup pitches, academic presentations, corporate innovation workshops, and technical training materials.
-
Slide Structure
2-slide layout with each slide divided into left text area (title and description) and right brain silhouette diagram section. Brain central and peripheral regions are highlighted in cyan and orange, with network connection lines representing node relationships. 16:9 widescreen format optimized for modern presentation environments.
Related Products
-

Business Analysis with Doughnut Chart – Dawn City Theme
#Product/Service Introduction #Business Introduction #Diagram
-

Solar System Illustration Diagram – Visual Aid for Market Analysis
#Business Introduction #Market and Competitor Analysis #Diagram
-

Simple PowerPoint Wide Template Connection Diagram
#Business Introduction #Business Vision and Strategy #Diagram
-

Key Chemical Composition Charts for Effective Data Visualization
#Business Introduction #Diagram #Business Areas
