Business Investment Process Diagram – Effective Procedure Visualization
RJ0300095_23
- Last Update 05/16/2025
- File Size 0.3MB
- # of Slides 2
- File Format PPTX
- Slide Ratio 16:9
- Color
Keywords
- #Content-Based Slides
- #Design-Based Slides
- #Operational Plan
- #Technical Approach
- #Diagram
- #Business Processes
- #Service Implementation Plan
- #Flow
- #Linear Flow
- #16:9
- #linear diagram PowerPoint
- #4-step process diagram
- #workflow process PowerPoint slide
- #business investment flowchart
- #process diagram PPT slide
- #how to create process flow in PowerPoint
About the Product
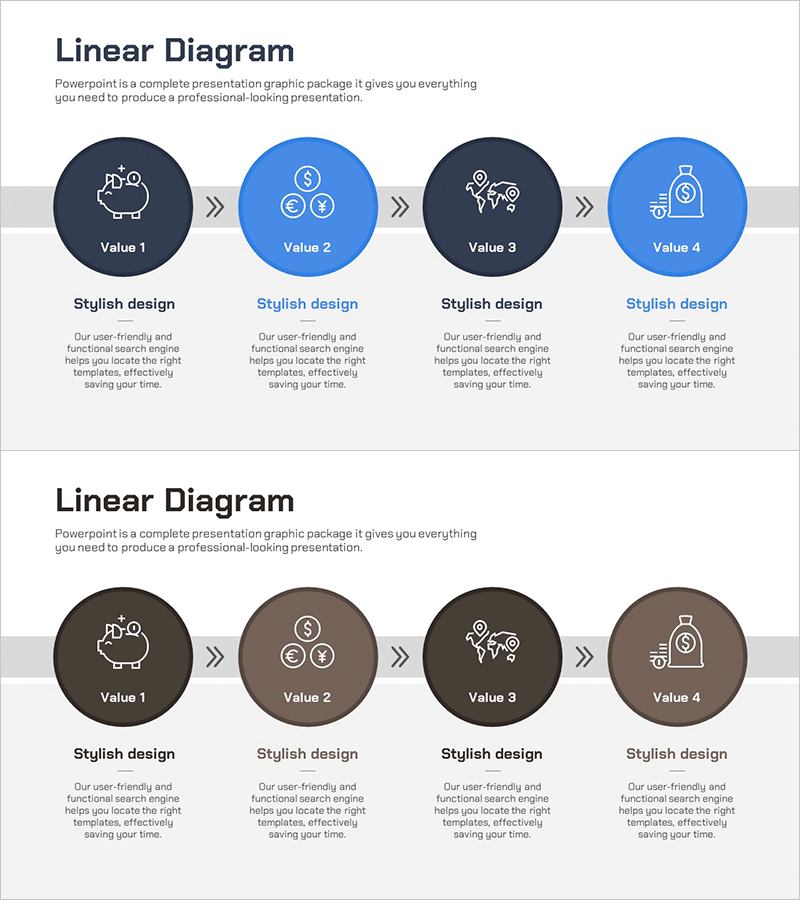
A 4-node linear diagram PowerPoint slide that visualizes business investment and workflow processes step by step. Navy and blue circular nodes connected by arrows clearly express sequential flow. Each stage includes icons and text areas, making it effective for explaining investment procedures, workflow stages, and business processes. Provided in two color combinations (navy-blue alternating and brown tone) to match your presentation topic and corporate branding. Wide 16:9 format in PPTX, ready for immediate editing and customization.
Usage Points
-
Main Usage
Visualizes sequential stages such as business investment procedures, workflow processes, product development stages, marketing campaign flows, and organizational decision-making processes. Icons and text in each node emphasize key content at each stage, enhancing audience comprehension and engagement.
-
How to Use
Enter stage names and descriptions in each circular node, and replace icons as needed to create a customized process diagram. Select color combinations to match your presentation topic and corporate image, then adjust background and fonts for visual consistency with the overall slide design.
-
Recommended For
Business plan presentations, investment pitch decks, project management reports, process improvement proposals, organizational structure explanations, marketing strategy meetings, and new employee training materials where step-by-step flow visualization is essential.
-
Slide Structure
Four circular nodes connected left to right with arrow connectors (>>). Each node contains an icon at the top, 'Value 1-4' text in the center, and a description area at the bottom. Two color combinations provided: navy-blue alternating and brown tone options.
Related Products
-

Flow Diagram Template for Idea Generation
#Operational Plan #Technical Approach #Diagram
-

Sleek Presentation Template Emphasizing Business Context
#Business Strategy #Operational Plan #Technical Approach
-

Circular Strategy Process for Goal Achievement
#Operational Plan #Technical Approach #Diagram
-

Visualizing Daily Work Processes – Effective Operational Planning
#Business Strategy #Operational Plan #Diagram
