Startup Business Global Market Strategy – Market Analysis and Goal Setting
RJ0300088_9
- Last Update 05/14/2025
- File Size 0.5MB
- # of Slides 2
- File Format PPTX
- Slide Ratio 16:9
- Color
Keywords
- #Content-Based Slides
- #Design-Based Slides
- #Company Introduction
- #Marketing Plan and Strategy
- #Graph
- #Other
- #Global Network
- #Target Market Strategy
- #Map
- #16:9
- #global market analysis PowerPoint slide
- #world map presentation design
- #market share comparison slide
- #how to present global strategy in PowerPoint
- #regional market analysis template
About the Product
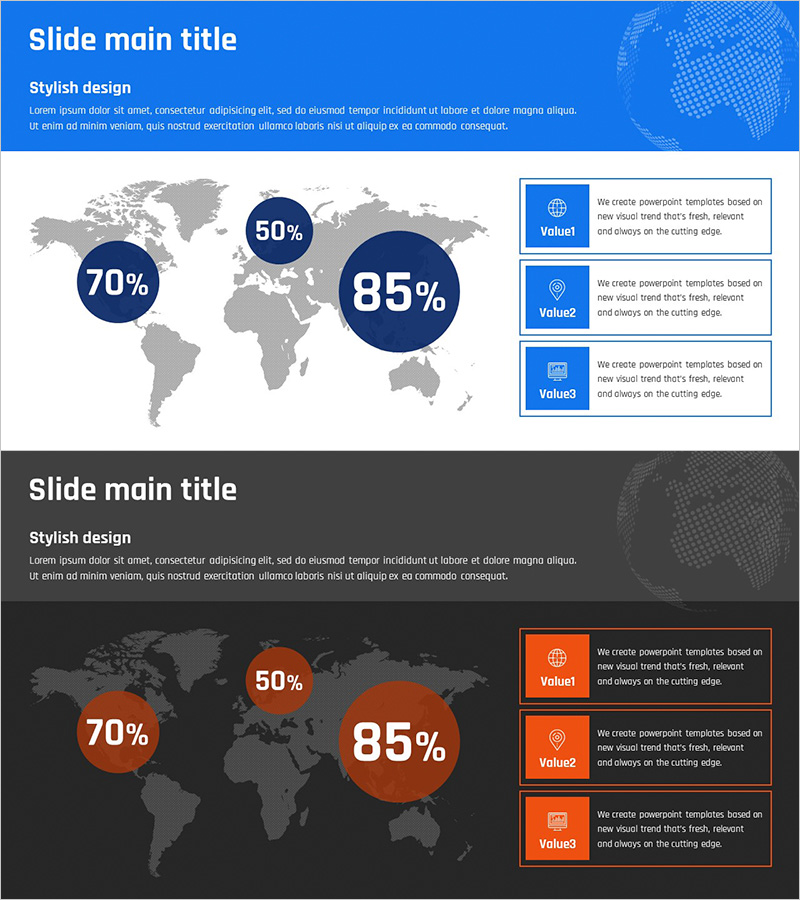
An essential map-based market analysis PowerPoint slide for global strategy presentations. This slide visualizes market share across three regions using pie charts overlaid on a world map, with three value propositions (Value1·Value2·Value3) arranged in blue boxes on the right. The 2-slide set features a bright blue background on the first slide and a dark gray background with orange accent on the second. With 6 text input areas (title, subtitle, 3 chart labels, 3 box texts), you can clearly communicate market data and strategic messages. Ideal for startup pitches, investor presentations, and global marketing strategy discussions.
Usage Points
-
Main Usage
Instantly compare regional market share and performance across the globe while simultaneously communicating each region's key value propositions. Optimized for investor pitches, executive briefings, and marketing strategy presentations to support data-driven decision-making.
-
How to Use
Enter each region's market share percentage (%) into the three pie charts on the world map, then fill the three boxes on the right with regional strategy, strengths, and opportunities. Use the blue background slide to emphasize positive results and the dark background slide when presenting risk factors or alternative scenarios.
-
Recommended For
Startup founders, business development managers, marketing strategists, global expansion executives, investment relations professionals, and consulting analysts who need to present market analysis findings with visual impact and credibility.
-
Slide Structure
Slide 1 (blue background): Title and subtitle + world map + 3 regional pie charts (50%, 70%, 85%) + 3 value boxes (blue). Slide 2 (dark background): identical layout with orange accent color. Total 6 text input areas for customizing region names, percentages, and strategic messages.
Related Products
-

Global Network Distribution Analysis – Visualizing Market Strategy
#Company Introduction #Marketing Plan and Strategy #Graph
-

Country-by-country Affiliate Status Analysis Graph – Global Network Strategy
#Company Introduction #Marketing Plan and Strategy #Graph
-

Analysis of Global Market Growth Trends - Challenges for Business Opportunities
#Company Introduction #Marketing Plan and Strategy #Graph
-

Global Target Market Strategy – Visualized Data
#Company Introduction #Marketing Plan and Strategy #Graph
