US Target Market Strategy – Data-Driven Market Analysis
RJ0300058_9
- Last Update 05/04/2025
- File Size 3.1MB
- # of Slides 2
- File Format PPTX
- Slide Ratio 16:9
- Color
Keywords
- #Content-Based Slides
- #Design-Based Slides
- #Market and Competitor Analysis
- #Marketing Plan and Strategy
- #Other
- #Target Market
- #Target Market Strategy
- #Map
- #16:9
- #USA map PowerPoint slide
- #market strategy map presentation
- #regional market analysis slide
- #target market map design
- #marketing map template
About the Product
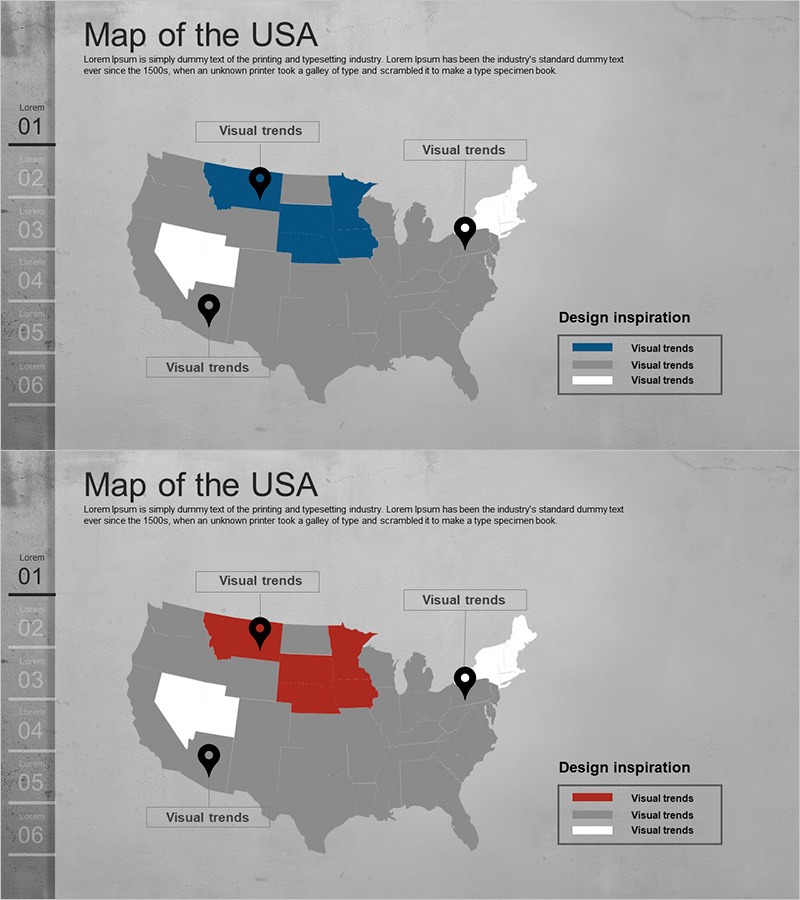
A map-based PowerPoint slide that visualizes market analysis and target market strategy across the United States. The slide features a grayscale US map with blue and red color coding to represent regional data, location pins, and a legend box to clearly communicate market segmentation. A numbered list (01–06) on the left side presents information in sequential order, while the right side legend defines visual trends. This presentation resource effectively conveys regional market conditions and target market strategies in marketing plans, competitive analysis, and investment proposals. The 2-slide set allows for scenario variations through color modifications.
Usage Points
-
Main Usage
This slide visualizes target market strategy by segmenting the US market regionally. Color coding and location pins on the map enable stakeholders to quickly understand market conditions, competitor distribution, and market entry strategies. It effectively communicates regional market opportunities and strategic priorities to investors, partners, and internal decision-makers.
-
How to Use
Use in the market analysis section of marketing plans, target market definition in business proposals, or market opportunity slides in investor pitches. The blue version can represent primary expansion regions while the red version shows highly competitive areas. Display both slides sequentially or present each as a separate scenario. Customize the legend and numbered list to match your company's data.
-
Recommended For
Marketing managers, business development teams, investor relations professionals, and executives preparing market reports. Ideal for presentations on US market entry, regional sales strategies, competitive analysis, and market share status. Suitable for B2B proposals, executive briefings, and investor pitches requiring credible market analysis.
-
Slide Structure
The slide comprises a title area, US map visualization, a left-side numbered list (01–06), and a right-side legend box. Three location pins on the map highlight key markets, while color differentiation (blue, red, gray, white) represents regional categories. Both slides maintain identical layouts with color variations, facilitating comparative analysis and scenario presentation.
Related Products
-

European Target Region Market Strategy – Effective Market Analysis
#Market and Competitor Analysis #Marketing Plan and Strategy #Other
-

Business USA Target Market Analysis – Predicting the Future with Data
#Market and Competitor Analysis #Marketing Plan and Strategy #Other
-

Asia-Focused Market Penetration Status - Data-Driven Market Analysis
#Market and Competitor Analysis #Marketing Plan and Strategy #Graph
-

Graph of the Status of European Target Region Analysis – Market Trends Visualization
#Market and Competitor Analysis #Marketing Plan and Strategy #Graph
