Analysis of the US Target Region – Market Strategy Visualization
RJ0300081_24
- Last Update 05/11/2025
- File Size 0.2MB
- # of Slides 2
- File Format PPTX
- Slide Ratio 16:9
- Color
Keywords
- #Content-Based Slides
- #Design-Based Slides
- #Market and Competitor Analysis
- #Marketing Plan and Strategy
- #Graph
- #Other
- #Target Market
- #Target Market Strategy
- #Column
- #Grouped Column
- #16:9
- #US market analysis PowerPoint
- #regional data visualization slides
- #clustered bar chart template
- #marketing strategy chart PPT
- #world map presentation slide
- #geographic data PowerPoint
About the Product
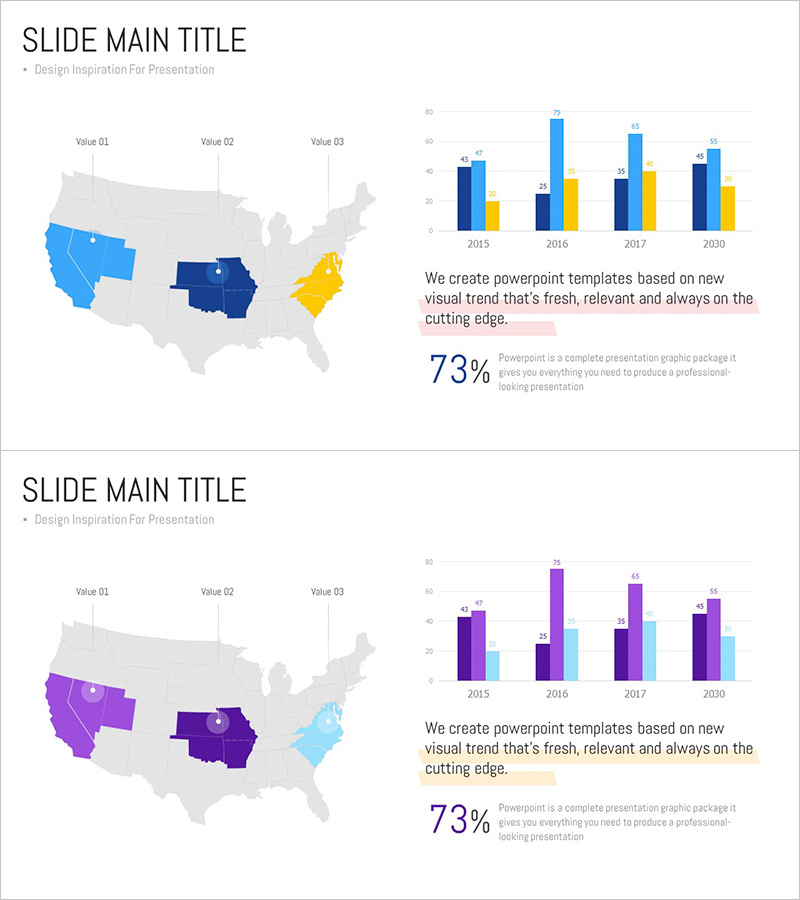
A 2-slide PowerPoint presentation designed for visualizing US target region analysis and market strategy. The first slide features a world map with US states highlighted in distinct colors to show geographic distribution. The second slide displays a clustered bar chart comparing four data series (blue, yellow, purple, and light blue) across four years (2015, 2016, 2017, 2020), enabling multi-dimensional market performance analysis. This slide set is ideal for marketing strategy presentations, regional sales reports, investment pitch decks, and competitive market analysis. All text, data labels, and color coding are fully editable to match your specific metrics and branding requirements.
Usage Points
-
Main Usage
Simultaneously display geographic distribution via map and temporal trends via clustered bar chart to enable comprehensive market analysis. Used for strategic planning, regional performance reporting, investment portfolio review, and data-driven decision-making in global business contexts.
-
How to Use
Begin by highlighting target regions on the world map using color coding to establish geographic scope. Transition to the clustered bar chart to present year-over-year and series-by-series comparisons with specific numerical values. Use the legend and data labels to clarify each data series, then guide the audience from geographic overview to detailed performance metrics during your presentation.
-
Recommended For
Marketing managers, sales directors, strategic planners, C-suite executives presenting regional results, investment professionals, market research analysts, and global business development teams seeking to communicate location-based performance data and market opportunities.
-
Slide Structure
Slide 1: World map with 3 US states highlighted in distinct colors + legend / Slide 2: Clustered bar chart with 4 years (2015, 2016, 2017, 2020) × 4 data series (blue, yellow, purple, light blue) + 73% statistic callout + descriptive text block
Related Products
-

Note Illustration Theme US Map & Graph – Market Analysis and Strategy Introduction
#Market and Competitor Analysis #Marketing Plan and Strategy #Graph
-

US Map Target Market Strategy – Marketing Plan and Analysis
#Market and Competitor Analysis #Marketing Plan and Strategy #Other
-

Continental Analysis Bar Graph – Enhance Market Competitiveness
#Market and Competitor Analysis #Graph #Other
-

Analysis of US Target Regions – Strategic Marketing and Opportunities
#Market and Competitor Analysis #Marketing Plan and Strategy #Diagram
