Timeline Diagram Slide Visualizing Annual Presentation Content
RJ0300080_7
- Last Update 10/06/2025
- File Size 1.3MB
- # of Slides 2
- File Format PPTX
- Slide Ratio 16:9
- Color
Keywords
About the Product
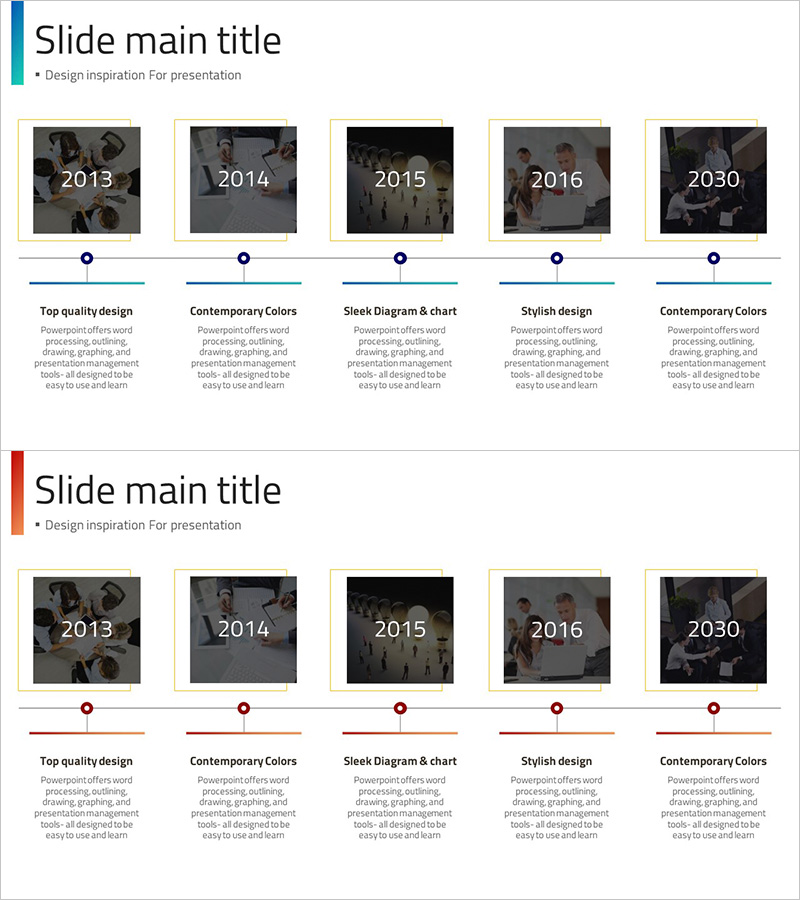
A 5-step timeline diagram PowerPoint slide designed to visualize annual presentation content and project progression. This 2-slide set offers both blue and red color versions, with editable image and text areas at each year node. The linear timeline structure intuitively represents time-sequential data such as project milestones, company history, marketing campaign schedules, and product roadmaps. Optimized for 16:9 widescreen format in PPTX, all elements are fully customizable to match your presentation style and branding requirements.
Usage Points
-
Main Usage
Represent time-sequential data such as project milestones, company history, marketing campaign schedules, and product launch roadmaps using a linear timeline structure. Each node accommodates images and text, enabling audiences to grasp annual achievements and key events at a glance.
-
How to Use
Enter the year and key content in the text box at each timeline node, then insert representative photos or icons in the image area. The blue version suits corporate presentations, while the red version is ideal for marketing and performance reports. Customize colors and fonts to align with your brand guidelines.
-
Recommended For
Business reports, annual performance presentations, company history introductions, product development roadmaps, marketing campaign timelines, investor pitch decks, and educational seminars. Suitable for executives, marketing professionals, project managers, and educators presenting time-based narratives.
-
Slide Structure
2-slide set featuring slide 1 with a blue 5-step timeline and slide 2 with a red 5-step timeline. Each slide includes a title area in the upper left, a central linear timeline with 5 nodes, and editable image boxes and text input areas for each node. Optimized for 16:9 widescreen aspect ratio.
Related Products
-

Newspaper Wide PowerPoint Template History – Visualizing Business Strategy
#Company Introduction #Business Strategy #Diagram
-

Infographic Design Wide Template History – Visualizing Company Growth
#Company Introduction #Diagram #History
-

Flow Diagram for Business Strategy Visualization – Professional PowerPoint Template
#Company Introduction #Business Strategy #Diagram
-

Color Theme Presentation Template Diagram – Visualizing Business Management Flow
#Company Introduction #Business Management #Diagram
