Infographic Slide Offering Visual Trends and Design Inspiration
RJ0300080_19
- Last Update 05/11/2025
- File Size 0.2MB
- # of Slides 2
- File Format PPTX
- Slide Ratio 16:9
- Color
Keywords
About the Product
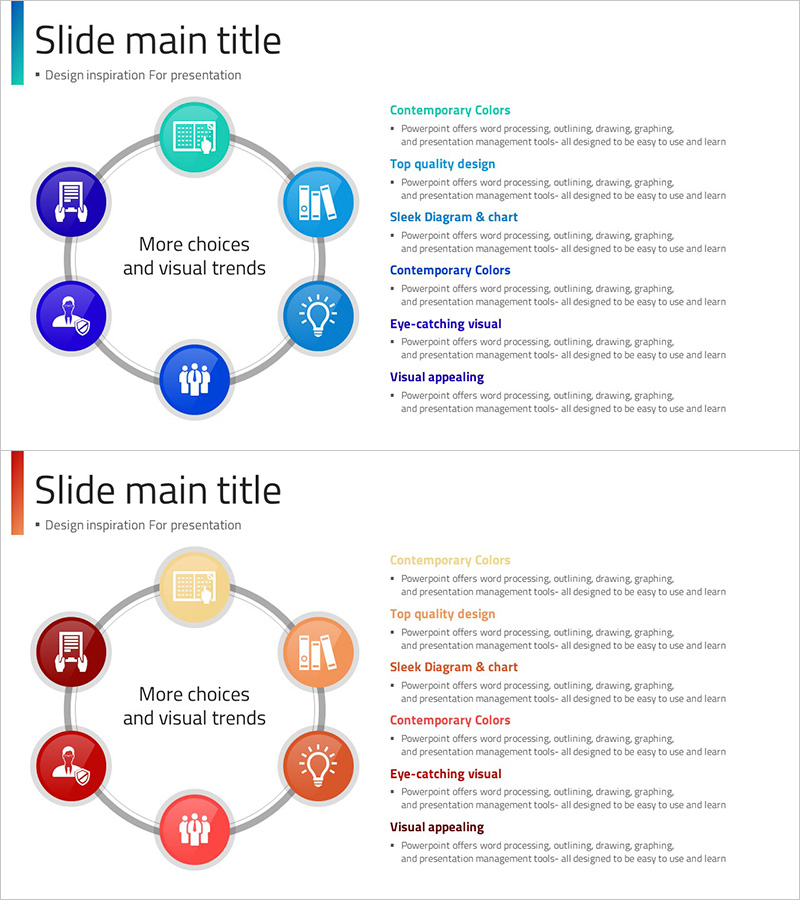
A circular diagram PowerPoint slide featuring five nodes radiating from a central concept with dual-tone blue and red color scheme. Each circular icon node is connected by circular lines to the center, with dedicated text areas for descriptions. This presentation slide is ready to use for process flows, business strategies, organizational structures, and product feature introductions. The 2-slide set includes color variations in blue and red tones, formatted in 16:9 widescreen PPTX for full editing capability.
Usage Points
-
Main Usage
Visualizes relationships where a central concept radiates outward to surrounding elements. Perfect for illustrating core business values and execution items, product features and benefits, organizational roles and departmental functions, or strategic pillars and implementation areas in a hierarchical manner.
-
How to Use
Enter your core concept (company name, strategy title, product name) in the center text box. Replace the five node icons and labels with your specific items. Add detailed descriptions in the right-side text areas to enhance audience understanding. Use the color-variant slide to create section breaks or emphasis effects throughout your presentation.
-
Recommended For
Executive reports, business plan presentations, product launch decks, organizational structure explanations, marketing strategy meetings, educational seminars, consulting proposals, and corporate training sessions. Especially effective when clearly communicating relationships between a central concept and multiple supporting elements.
-
Slide Structure
2-slide set with identical diagram structure in two color variations: blue-tone and red-tone. Each slide features one central circular node surrounded by five peripheral nodes connected by circular lines. Description text areas are positioned on the right side of each slide for detailed explanations.
Related Products
-

Financial Services Sector Diagram - Visualizing Business Values with Non-Central Diagram
#Company Introduction #Business Introduction #Diagram
-

Business Closure Diagram – Slide for Business Introduction
#Company Introduction #Business Introduction #Diagram
-

Cooperative Partner Business Areas Diagram
#Company Introduction #Business Introduction #Diagram
-

Financial Services Sector Diagram – Business Introduction and Vision
#Company Introduction #Business Introduction #Diagram
