Big Data Domain Triangle Diagram
RJ0400053_29
- Last Update 06/01/2025
- File Size 1.7MB
- # of Slides 2
- File Format PPTX
- Slide Ratio 16:9
- Color
Keywords
- #Content-Based Slides
- #Design-Based Slides
- #Company Introduction
- #Business Introduction
- #Diagram
- #Other
- #Business Areas
- #Business Areas
- #Spread
- #16:9
- #big data diagram PowerPoint
- #triangle analysis slide
- #3-segment comparison presentation
- #business domain visualization PPT
- #data area segmentation slide
About the Product
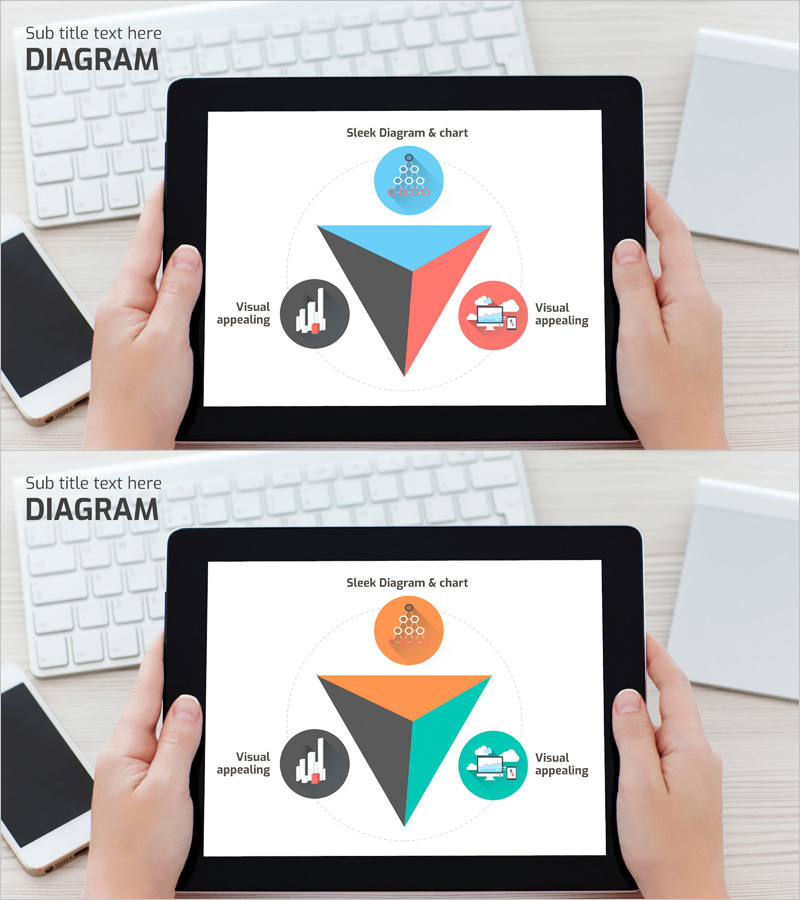
A PowerPoint slide featuring a triangle diagram that divides big data business domains into three distinct segments. The top circular icon represents core concepts, the left chart icon symbolizes analytics capabilities, and the right technology icon denotes technical foundation. The central triangle is available in multiple color combinations including blue-red, orange-teal, and more, with clearly defined text input areas for each segment. This 16:9 PPTX format slide enables instant editing and is ideal for business strategy presentations, data analytics proposals, and corporate capability briefings.
Usage Points
-
Main Usage
Visualizes a company's big data business domains, data analytics strategy, and technical capabilities across three interconnected segments. The triangle structure intuitively conveys the relationship and balance between each domain, making it ideal for communicating business portfolios to investors, employees, and partners.
-
How to Use
Enter business domain names, core functions, and technical characteristics in each segment's text area. The top icon represents core concepts, the left icon shows analytics strength, and the right icon indicates technical foundation. Customize colors to match your corporate brand and place in strategy sections of business plans, strategic reports, or investor presentations.
-
Recommended For
Perfect for big data, AI, and cloud computing companies presenting business strategies, data analytics solution proposals, and technology capability overviews. Ideal for executive, investor, and technical audience presentations where complex business domains need clear structural representation.
-
Slide Structure
Two-slide set featuring identical layouts with two color variations: blue-red combination and orange-teal combination. Each slide includes a title area at the top, a central triangle diagram with three editable segments, and three circular icon areas (top, left, right) with fully customizable text and shapes.
Related Products
-

Silhouette Diffusion 3D Diagram – Dynamic Business Structure Representation
#Company Introduction #Business Introduction #Diagram
-

Human Head Structure Diagram – Simple and Intuitive Visualization
#Company Introduction #Business Introduction #Diagram
-

Circular Graph Diagram for Business Introduction
#Company Introduction #Business Introduction #Diagram
-

Promotional Strategy Triangle Overlay Diagram
#Company Introduction #Business Introduction #Diagram
