Competitor Sales Comparison Graph – Market and Competitor Analysis
RJ0300074_22
- Last Update 05/09/2025
- File Size 0.1MB
- # of Slides 2
- File Format PPTX
- Slide Ratio 16:9
- Color
Keywords
About the Product
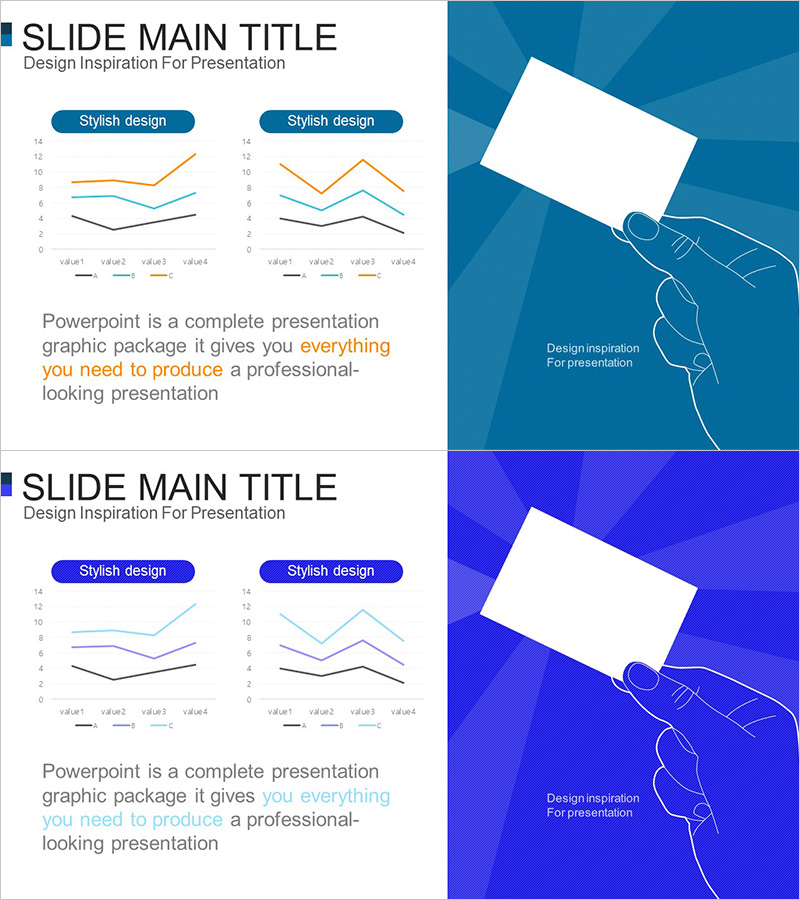
A 2-slide PowerPoint presentation template designed for competitor sales comparison and market analysis. The left section features a title and descriptive text area, while the right side displays two line charts for visualizing sales trends over time. The dark blue geometric background contrasts with white chart areas to maximize data readability, and orange accent text highlights key messages. The right full-color section provides space for brand imagery or additional visual elements. This slide deck is ideal for business reports, investor presentations, and competitive positioning discussions where data-driven market insights are essential.
Usage Points
-
Main Usage
This slide visualizes competitor sales trends and market share using dual line charts. It enables you to present time-based growth rates, market dynamics, and competitive advantages to investors, executives, and partners with clear data-driven insights.
-
How to Use
Enter your analysis title (e.g., 'Market Share Trends', 'Competitor Sales Comparison') and key insights in the left text area. Input actual sales data into the two chart areas on the right to complete the line graphs. Use orange accent text to highlight critical figures or conclusions, and insert company logos or additional images in the right full-color section.
-
Recommended For
Ideal for business reports, investor presentations (IR), executive briefings, market analysis presentations, and strategic planning meetings. Particularly effective for finance teams, marketing departments, and business planning teams demonstrating competitive advantages through quantitative data.
-
Slide Structure
2-slide set with consistent layout: left text area with title and description, right side featuring two line chart zones and one image insertion space. Each slide maintains the same structure to present different data sets while preserving visual coherence throughout the presentation.
Related Products
-

Competitor Comparison Line Graph
#Market and Competitor Analysis #Graph #Competitor Analysis
-

Summary Analysis Bar Chart Bundle – Optimal for Market Competitor Analysis
#Market and Competitor Analysis #Graph #Competitor Analysis
-

Third Party Comparison Pentagon Area Graph – Competitive Advantage Analysis
#Market and Competitor Analysis #Graph #Competitor Analysis
-

Market Competition: Deep Dive into Top 3 Firms
#Market and Competitor Analysis #Graph #Competitor Analysis
