Financial Program Cluster Diagram
RJ0300071_13
- Last Update 05/08/2025
- File Size 0.3MB
- # of Slides 2
- File Format PPTX
- Slide Ratio 16:9
- Color
Keywords
- #Content-Based Slides
- #Design-Based Slides
- #Product/Service Introduction
- #Business Vision and Strategy
- #Diagram
- #Program Introduction
- #Business Goals
- #Cluster
- #Closed Cluster Diagram
- #16:9
- #financial cluster diagram
- #financial program PowerPoint slide
- #closed-loop diagram template
- #financial relationship chart
- #investment portfolio presentation
- #financial system visualization
About the Product
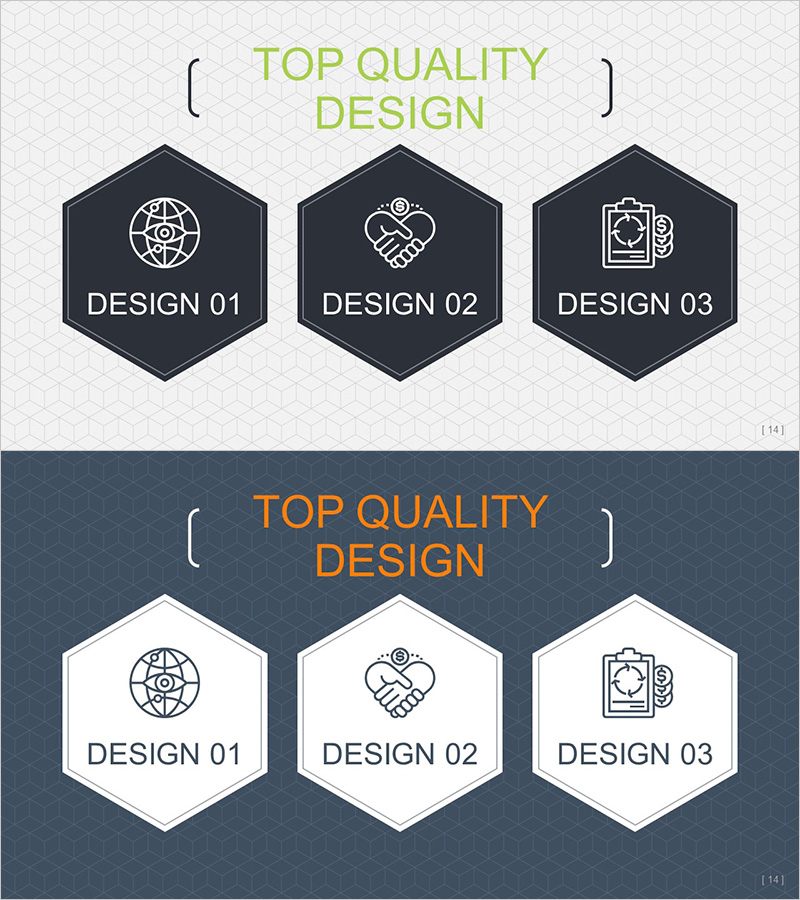
A PowerPoint cluster diagram slide that visualizes the interconnected relationships of financial programs. The design features a central core element connected to three related financial programs in a closed-loop structure, ideal for illustrating financial systems, investment portfolios, and asset management strategies. Built with a dark navy hexagonal background, white icons, and clear typography to enhance credibility in financial presentations. Two design versions (dark and light) are included for flexible background adaptation, and all text and icons are fully editable for immediate use with your actual financial data.
Usage Points
-
Main Usage
Clearly visualizes the interconnected relationships of financial systems, investment portfolios, and asset management components. The closed-loop structure with a central concept surrounded by connected programs makes complex financial structures intuitive and easy to understand, enhancing audience comprehension of multi-layered financial concepts.
-
How to Use
Use in financial institution presentations, investor briefings, and internal training sessions to explain financial product relationships, asset allocation strategies, and risk management frameworks. Edit the node text and icons to input actual program names, returns, risk levels, and other relevant financial metrics for immediate deployment.
-
Recommended For
Financial professionals, investment specialists, asset managers, financial consultants, and treasury teams presenting financial product structures, portfolio composition, and asset allocation strategies. Particularly effective for explaining complex financial products, multi-tier investment structures, and interconnected financial systems to stakeholders.
-
Slide Structure
Central hexagonal node surrounded by three satellite nodes positioned at upper-left, upper-right, and bottom in a closed-loop configuration. Each node contains icon and text input areas. Includes two versions—dark navy background and light background—allowing you to match your presentation theme while maintaining visual consistency.
Related Products
-

Introduction to the Financial Business Program – A Differentiated Strategic Approach
#Product/Service Introduction #Business Vision and Strategy #Diagram
-

Business Objectives Square Diagram – Effective Strategy Formulation
#Product/Service Introduction #Business Vision and Strategy #Diagram
-

Introducing the Startup Business Program – Innovation and Growth
#Product/Service Introduction #Business Vision and Strategy #Diagram
-

Introduction to Positive Business Practices – Professionalism and Trust
#Product/Service Introduction #Business Vision and Strategy #Diagram
