Job Ability Assessment and Analysis Graph – Building Foundation for Achievement
RJ0300062_12
- Last Update 05/05/2025
- File Size 0.1MB
- # of Slides 2
- File Format PPTX
- Slide Ratio 16:9
- Color
Keywords
- #Content-Based Slides
- #Design-Based Slides
- #Product/Service Introduction
- #Business Introduction
- #Diagram
- #Graph
- #Business Areas
- #Technological Status
- #Cluster
- #Other
- #Closed Cluster Diagram
- #Area Chart
- #16:9
- #radial graph PowerPoint
- #5-point diagram template
- #job ability assessment slide
- #competency analysis chart
- #PowerPoint graph slide design
About the Product
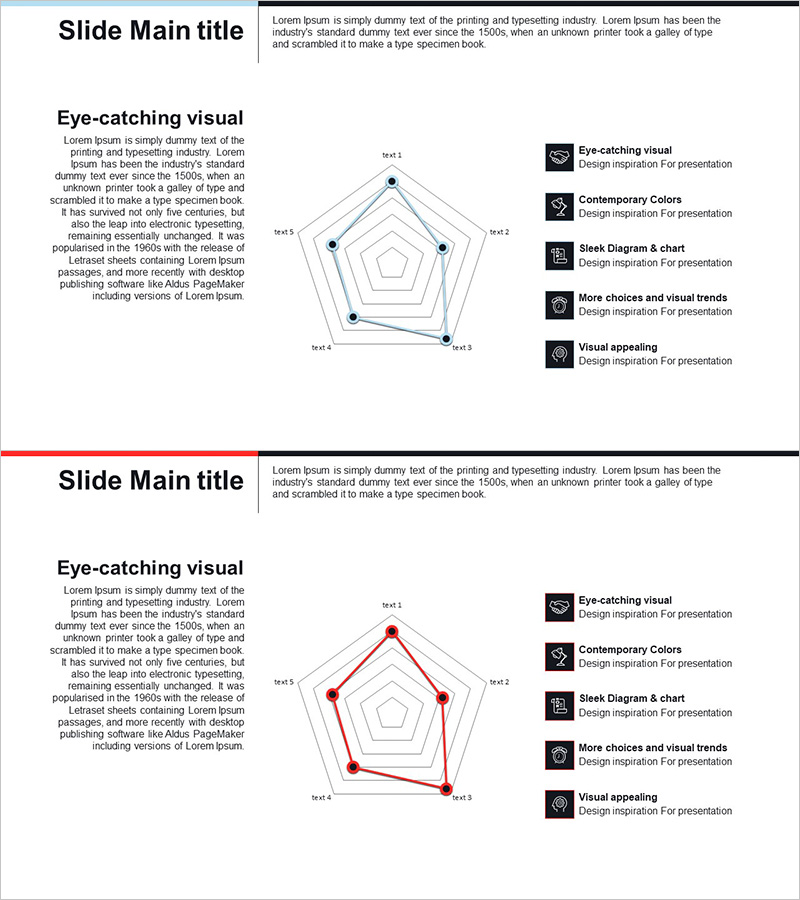
A PowerPoint slide template that visualizes job ability assessment across five dimensions using a radial graph design. The diagram features blue outline nodes and connecting lines forming a pentagon shape, with each axis labeled Text 1 through Text 5 for flexible customization. The second slide presents the same structure in red for comparative analysis and performance tracking. Ideal for HR presentations, competency evaluations, performance reviews, and skill gap analysis in business settings. Ready to download and edit immediately for your assessment and analysis needs.
Usage Points
-
Main Usage
Designed to evaluate employee competencies, analyze departmental performance, and diagnose foundational capabilities across five key dimensions. The radial format allows simultaneous comparison of multiple metrics, making strengths and gaps immediately visible. Color variations enable time-based or department-based comparisons within a single presentation.
-
How to Use
Replace Text 1 through Text 5 labels with your specific evaluation criteria (e.g., Technical Skills, Communication, Leadership, Problem-Solving, Teamwork). Adjust node positions along each axis to match your data values. Use the blue slide as a baseline and the red slide as current performance, or overlay both to highlight improvement trends and progress over time.
-
Recommended For
HR and organizational development teams conducting competency assessments, executive performance reviews, manager feedback sessions with direct reports, and training institutions evaluating learner progress. Effectively communicates quantitative evaluation data to support decision-making, development planning, and performance improvement initiatives.
-
Slide Structure
Pentagon-shaped radial diagram with five axes extending from center point. Each axis terminates in a circular node, with connecting lines forming a five-sided polygon that represents the data profile. Two versions provided: blue for baseline/reference and red for current performance or alternative scenario comparison.
Related Products
-

Square Frame Presentation Template – Business Introduction and Tech Status
#Product/Service Introduction #Business Introduction #Diagram
-

Closed Diagram of Plastic Surgery
#Product/Service Introduction #Business Introduction #Diagram
-

Clustering Diagram Slide for Interior Business Program Overview
#Product/Service Introduction #Business Introduction #Diagram
-

Business Area List Diagram – Systematic Structure and Clear Information Delivery
#Product/Service Introduction #Business Introduction #Diagram
