Business Process Connection Diagram – Effective Business Operation Strategy
RJ0300059_9
- Last Update 05/04/2025
- File Size 0.8MB
- # of Slides 2
- File Format PPTX
- Slide Ratio 16:9
- Color
Keywords
- #Content-Based Slides
- #Design-Based Slides
- #Business Strategy
- #Operational Plan
- #Diagram
- #Step-by-Step Schedule Plan
- #Business Processes
- #Cluster
- #Chain Diagram
- #16:9
- #connection diagram PowerPoint
- #business process flow slide
- #process diagram template
- #PowerPoint diagram slide
- #organizational process visualization
About the Product
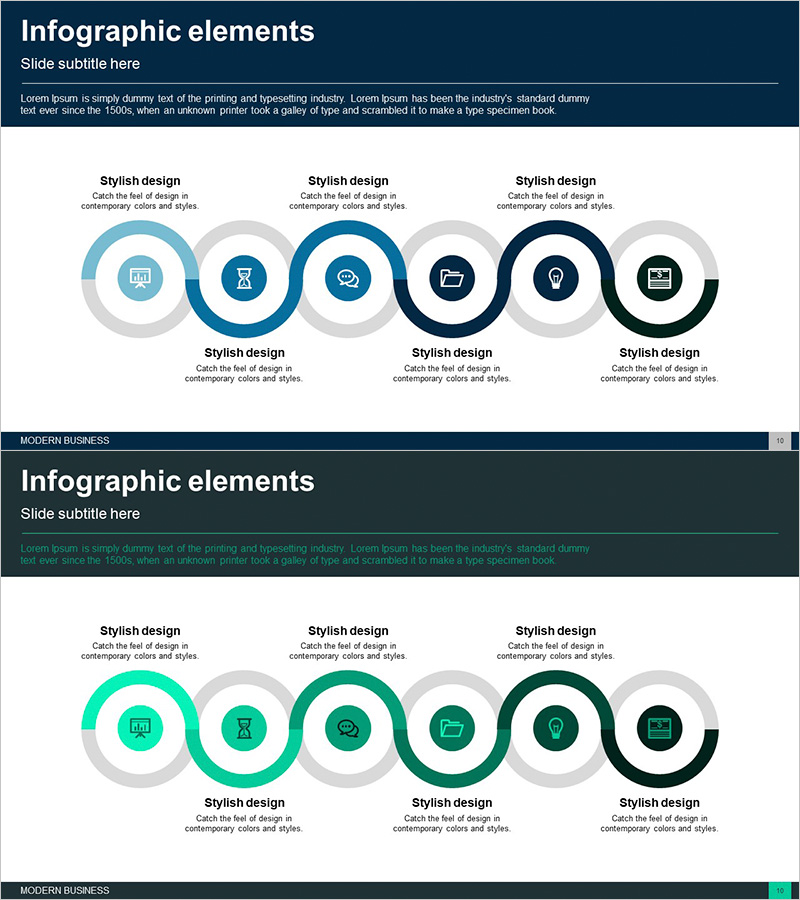
A 6-node connection diagram PowerPoint slide that visualizes business processes and interdepartmental relationships. Circular nodes in dark blue, light blue, and gray tones are connected by arrows, clearly expressing workflow stages and mutual dependencies. The 2-slide set provides variant color versions of the same layout for flexible presentation options. Instantly applicable to business operation strategy presentations, process improvement initiatives, and cross-departmental collaboration explanations.
Usage Points
-
Main Usage
Optimized for visually representing organizational workflows and interdepartmental relationships. Each node clearly indicates a specific role, and arrow connections enable instant comprehension of workflow sequence and interdependencies. Suitable for business operation strategy presentations, process improvement proposals, and organizational structure explanations.
-
How to Use
Customize each node with department names, task titles, or stage labels to match your organization's actual processes. Arrow directions and node positioning support linear, circular, and multi-directional flow representations. The 2-slide format allows color variations for comparative or contrasting structure demonstrations.
-
Recommended For
Recommended for executives, team leads, and project managers explaining organizational strategies, workflow improvements, and collaboration structures. Ideal for consulting firms, manufacturing companies, financial institutions, and IT enterprises using process-centric presentations for internal reports, external proposals, and training materials.
-
Slide Structure
Six circular nodes sequentially connected by arrows in a symmetric left-right layout with three nodes on top and three on bottom. Central arrows clearly indicate relationships between nodes. Dark blue, light blue, and gray color combinations visually distinguish node priorities and functional roles.
Related Products
-

Business Process Diagram – Optimizing Workflow
#Business Strategy #Operational Plan #Diagram
-

Integrated Healthcare Diagnosis Flow – Effective Business Strategy
#Business Strategy #Operational Plan #Diagram
-

Cascading Bubble Flow Slide – Business Strategy and Operations Planning
#Business Strategy #Operational Plan #Diagram
-

Idea Meeting Process - Multidirectional Flow Diagram
#Business Strategy #Operational Plan #Diagram
