Business Area Circular Diagram – Visualizing Cluster Information
RJ0300059_7
- Last Update 05/04/2025
- File Size 0.8MB
- # of Slides 2
- File Format PPTX
- Slide Ratio 16:9
- Color
Keywords
- #Content-Based Slides
- #Design-Based Slides
- #Company Introduction
- #Business Introduction
- #Diagram
- #Business Areas
- #Business Areas
- #Cluster
- #Closed Cluster Diagram
- #16:9
- #closed cluster diagram
- #circular diagram PowerPoint
- #layered structure presentation
- #business area visualization slide
- #cluster diagram template PowerPoint
About the Product
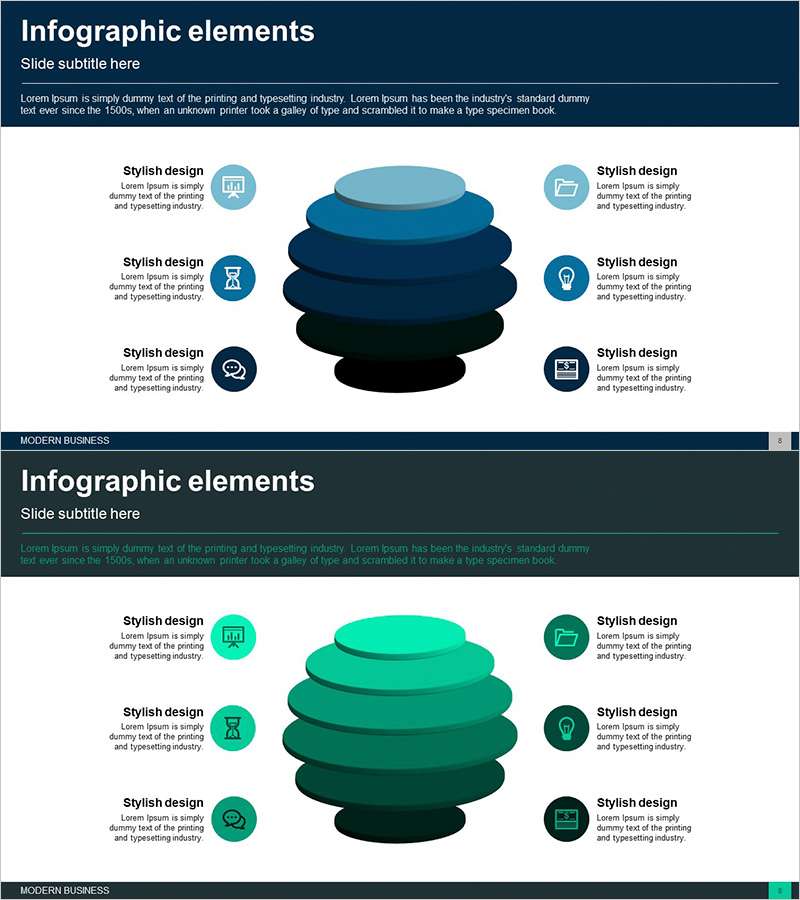
A closed-form cluster diagram PowerPoint slide that visualizes six surrounding items around a central concept using a layered circular structure. Three-tier gradient shading in dark blue, light blue, and turquoise creates depth perception, with icons and text fields positioned at each layer to intuitively represent complex information such as business areas, organizational structures, and product portfolios. Available in 16:9 ratio, 2-slide PPTX format, fully editable and ready for immediate use in company introductions, business strategy presentations, organizational restructuring announcements, and other professional contexts.
Usage Points
-
Main Usage
Simultaneously express the relationship and hierarchy of six surrounding items centered on a core concept using a closed-form cluster structure. Visualize interconnected information such as business area classification, organizational hierarchy, product portfolio, and strategic elements in layers to enhance audience comprehension.
-
How to Use
Use when introducing business areas in company introduction slides, expressing departmental relationships during organizational restructuring announcements, or categorizing product lineups by hierarchy. Edit text and icons in each layer to customize according to your organization's context.
-
Recommended For
Recommended for executives, business development teams, marketing teams, and organizational development teams to clearly communicate complex structures in strategy meetings, investor presentations, and internal communications. Particularly effective for organizational structure introductions, business portfolio presentations, and ecosystem mapping.
-
Slide Structure
Central circular core area surrounded by three-tier gradient layers (dark blue → light blue → turquoise). Six items arranged symmetrically—three on left, three on right—each with circular icon and text input field. Two-slide set with color variations in dark blue and green palettes.
Related Products
-

Financial Management Area Diagram – Integrated Visualization for Business Introduction
#Company Introduction #Business Introduction #Diagram
-

Business Overview Square Diagram – Clear Business Introduction
#Company Introduction #Business Introduction #Diagram
-

Representative Ingredients Slide for Business Insights
#Company Introduction #Business Introduction #Diagram
-

Automotive Maintenance Service Business Area – Cluster Diagram
#Company Introduction #Business Introduction #Diagram
