Business Area Circular Nesting Diagram – Cluster Visualization
RJ0300052_7
- Last Update 05/02/2025
- File Size 4.3MB
- # of Slides 2
- File Format PPTX
- Slide Ratio 16:9
- Color
Keywords
- #Content-Based Slides
- #Design-Based Slides
- #Company Introduction
- #Business Introduction
- #Diagram
- #Business Areas
- #Business Areas
- #Cluster
- #Combination Diagram
- #16:9
- #circular nesting diagram PowerPoint
- #cluster diagram slide template
- #4-node business structure chart
- #overlapping circles diagram
- #organizational relationship chart PowerPoint
About the Product
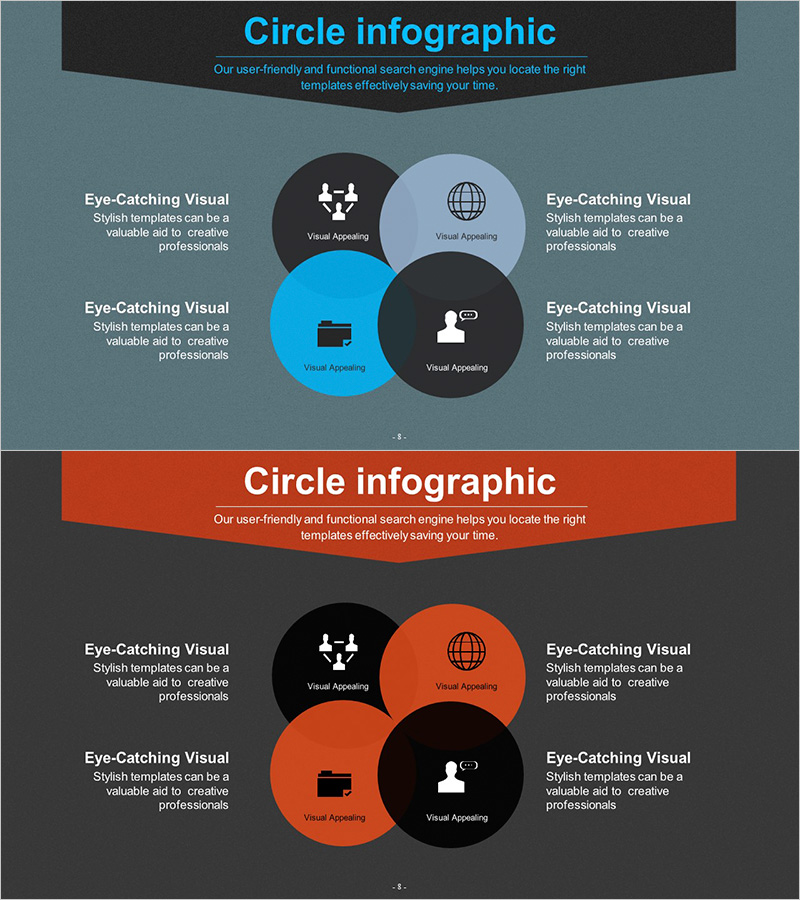
A four-node circular nesting diagram PowerPoint slide designed to visualize business divisions, organizational structures, and interconnected relationships. The central core element is surrounded by four overlapping circles in blue, black, and gray tones, clearly distinguishing each area while emphasizing mutual connections and hierarchical relationships. Icons and text labels enhance information clarity and visual appeal. This presentation slide template is ready to use for business strategy presentations, organizational charts, departmental relationship mapping, and corporate structure explanations.
Usage Points
-
Main Usage
Visualize interdepartmental interactions, business unit connections, project team compositions, and strategic relationship maps using an overlapping circular structure. Simplifies complex organizational relationships into clear, easy-to-understand visuals. Ideal for executive briefings, organizational restructuring explanations, and strategic planning meetings to maximize message impact.
-
How to Use
Enter department names, business areas, or roles into each circular node. Replace the central icon with your core concept. Customize colors to match organizational hierarchy or priority levels. Add text labels to enhance relationship descriptions. Optimized for 16:9 widescreen format, perfect for large-screen presentations and conference displays.
-
Recommended For
Executives and senior management presenting organizational structures, marketing teams introducing business portfolios, strategic planning teams analyzing interdependencies, HR departments defining organizational charts and roles, consulting firms presenting client structure analysis and relationship mapping.
-
Slide Structure
Two-slide set. Slide 1: Blue background with four overlapping circular nodes (black, gray, light blue, cyan) + central icon (network, globe, people, document) + left and right text areas. Slide 2: Orange background with identical four-node structure in warm color tones. Each node is independently editable with easy icon and text replacement.
Related Products
-

Diagram Introducing Business Activity Areas – Visualizing Business Areas
#Company Introduction #Business Introduction #Diagram
-

Entertainment Business Area Diagram – Dynamics of Business
#Company Introduction #Business Introduction #Diagram
-

Security Business Area Diagram – Cluster Visualization for Business Presentation
#Company Introduction #Business Introduction #Diagram
-

Business Area Overlay Diagram – A Blend of Visual Appeal and Functionality
#Company Introduction #Business Introduction #Diagram
